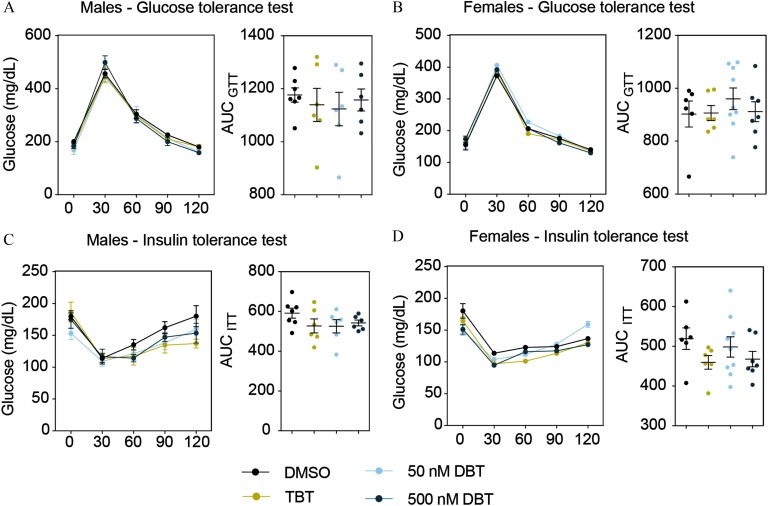
Figure 5.
DBT effects on glucose homeostasis in males and females from set 1. Glucose levels and area under the curve (AUC) during glucose tolerance (A, B) and insulin tolerance (C, D) tests in males and females. Animals were fasted for 4 h prior to the test. Glucose or insulin was administered by intraperitoneal injection and glucose levels were measured every 30 min for the next 120 min. AUC was calculated for each animal independently and averaged for each treatment group. Two-way analysis of variance (ANOVA) was conducted to compare DMSO and the different treatments, followed by Sidak’s post-hoc test for glucose levels at each time point. One-way ANOVA was conducted to compare DMSO and the different concentrations of DBT, followed by Dunnett’s post-hoc test to compare differences in AUC. Unpaired t-test was conducted for TBT versus vehicle. . Data are expressed as the Note: DBT, dibutyltin; DMSO, dimethylsulfoxide; SEM,standard error of the mean; TBT, tributyltin.

