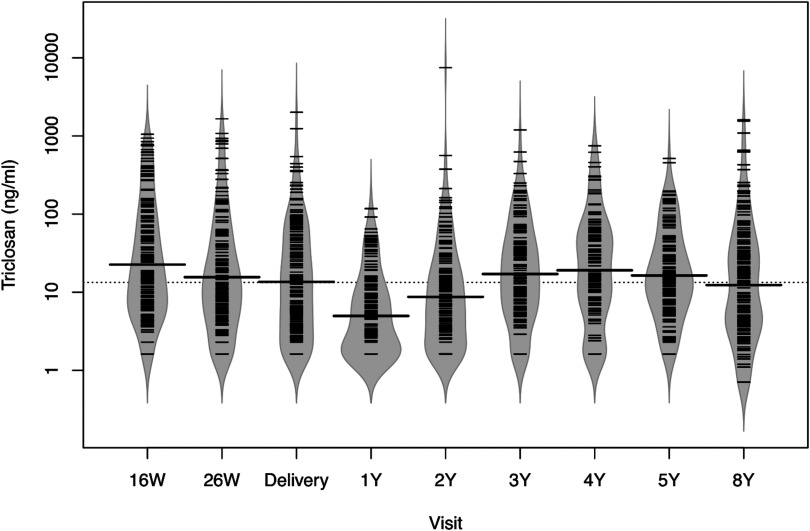
Figure 1.
Bean plots of urinary triclosan concentrations from 16 wk of pregnancy until children completed the 8-y-of-age study visit among mother–child pairs from the HOME Study. HOME, Health Outcomes and Measures of the Environment study; W, weeks of gestation; Y, age in years. Dotted line represents overall median urinary triclosan concentration and solid line in each bean plot represents the median urinary triclosan concentration for that visit. Fringes within each plot represent individual observations, and shaded area the density function of triclosan concentrations; , 192, 181, 174, 155, 159, 128, 156, and 198, respectively.

