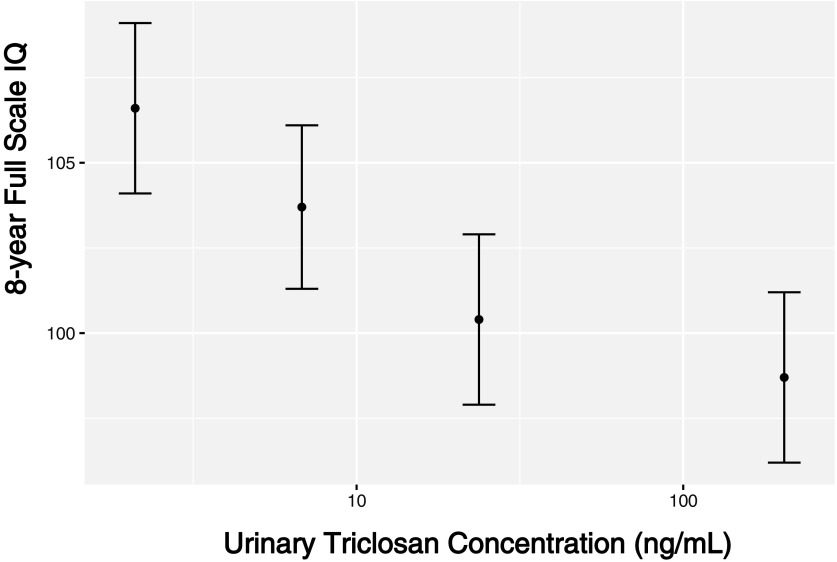
Figure 4.
Adjusted least squared mean child FSIQ scores at 8 y of age by quartile of urinary triclosan concentrations at delivery (). Betas and 95% confidence intervals derived from a multiple informants model. FSIQ, Full-Scale Intelligence Quotient; max, maximum; min, minimum. Least mean squared linear regression model adjusted for urinary creatinine concentrations and serum cotinine concentrations (continuous), child sex (male vs. female), child race/ethnicity (white-non-Hispanic, black-non-Hispanic, or other), household income (continuous), marital status (married vs. unmarried), maternal education (high school or less, some college, or college graduate or more), caregiving environment scores (continuous), and maternal FSIQ (continuous). Error bars represent 95% confidence intervals. Median (min–max) urinary triclosan concentrations in 1st (), 2nd (), 3rd (), and 4th () quartiles were (), 6.1 (3.6–13), 22 (13–44), and 90 (47–2013) ng/mL, respectively.

