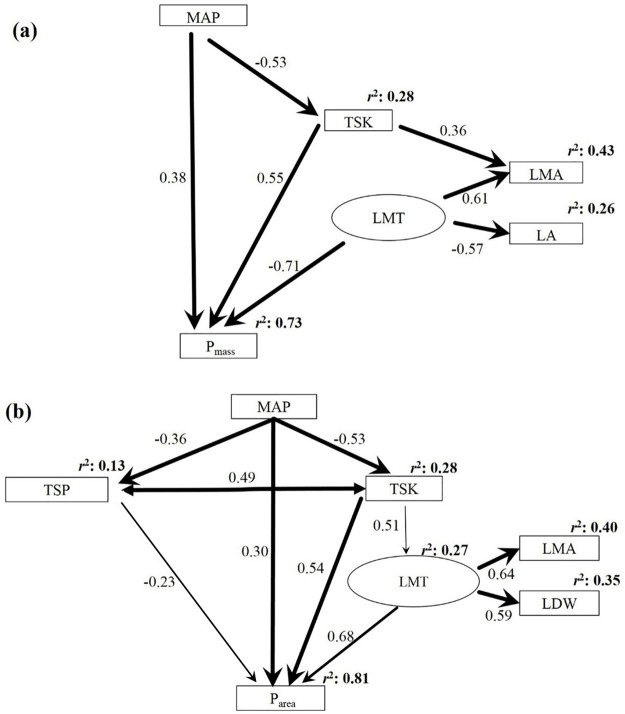
Fig 2. Final SEMs linking Pmass and Parea and their drivers.
Single headed arrows indicate a causal influence of one variable upon another. Narrow arrows indicate P < 0.05; wider arrows indicate P < 0.01; and the widest arrows indicate P < 0.001. Values on arrows indicate standardized coefficients. The value at the top-right corner of each variable (r2) represents the proportion of variance explained. Abbreviations: MAP, mean annual precipitation; TSK, total soil potassium; TSP, total soil phosphorus; LMT, leaf morphological trait; LMA, leaf mass per area; LA, leaf area; LDW, leaf dry weight; Pmass, leaf phosphorus per unit mass; Parea, leaf phosphorus per unit area.

