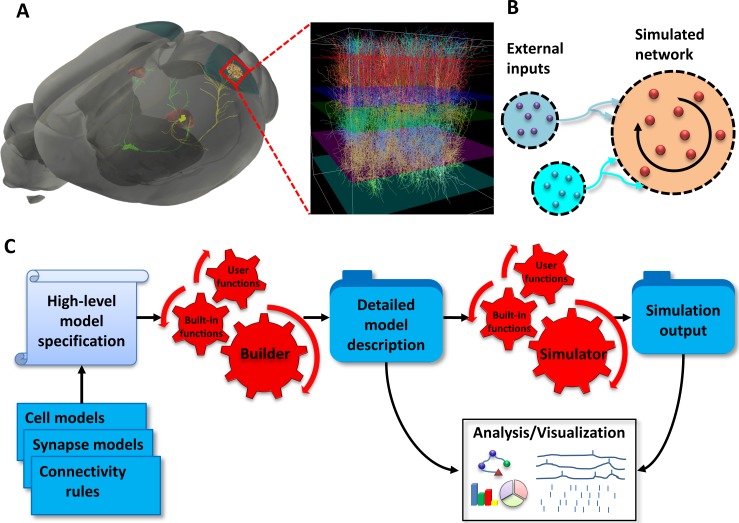
Fig 1. Modeling paradigm.
(A) Modeling a large-scale network of neurons of the mouse primary visual cortex (area V1) as an example. Anatomically, retinal ganglion cells project (green), among other targets, to the Lateral Geniculate Nucleus (LGN) of the thalamus (red). The LGN cells project to V1 (zoomed-in view). In this example, the LGN activity is pre-generated and treated as external input, whereas V1 is simulated explicitly (“simulated network”). (B) Conceptual representation of the network model as a set of populations of external sources providing feedforward inputs (blue circles) and the simulated network (orange circle), which is recurrently interconnected. (C) Stages of the modeling workflow: The model components (blue stack) and the high-level model specification (scroll) are passed to the builder (red gears) to produce detailed model description as a set of files (blue folder). This network description serves as an input to the simulator (red gears) to produce the simulation output as a set of files (blue folder). In turn, the outputs from the simulator and builder serve as input for the analysis and visualization tools (white board).

