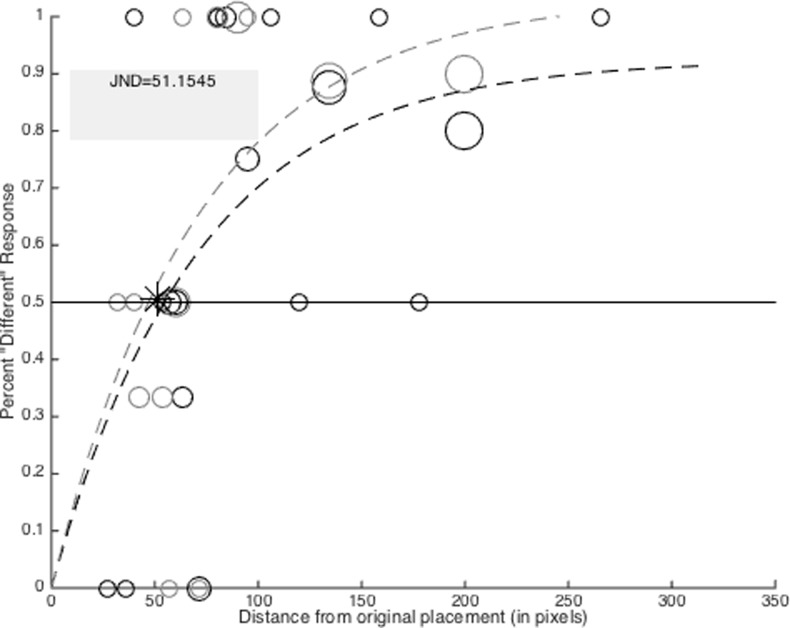
Fig 2. JND output example.
Outcome of JND estimation task for a single participant. The light and dark circles and dotted lines represent JND trials for 3 and 5 dot conditions respectively. The size of each dot represents the number of trials experienced at that distance from the original position of the target dot location. Each staircase procedure began with a spatial deviation of 150 pixels. The JND was calculated as the average point along the x-axis at which both non-linear trend lines crossed the 50% correct response point along the y-axis. The JND is marked with a ‘*’.

