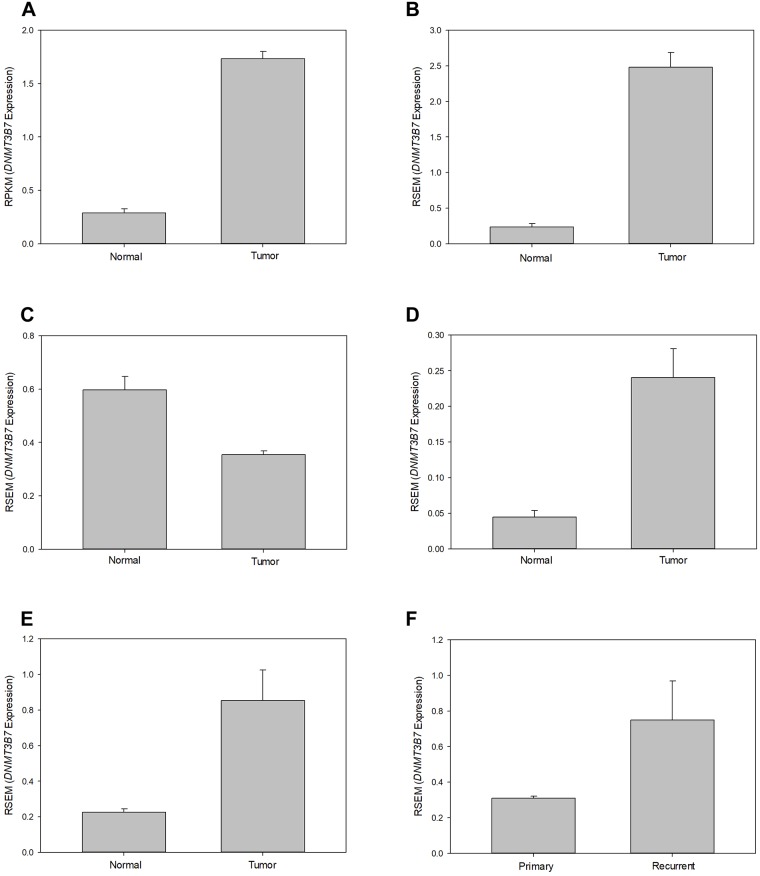
Fig 1. Expression of DNMT3B7 in normal and tumor patient samples.
Representative graphs of 6 different tumor samples showing relative DNMT3B7 expression, as measured by reads per kilobase per million (RPKM) or RNA-Seq by Expectation Maximization (RSEM), in unmatched normal and tumor tissues in (A) HNSC, (B) UCEC, and (C) THCA. Expression of DNMT3B7 in matched patient samples is shown in (D) LIHC and (E) LUAD. DNMT3B7 expression in primary and recurrent tissues in (F) LGG (p = 0.005) was assessed when normal samples were not available. All samples shown here were significant, p < 0.001, unless otherwise stated.

