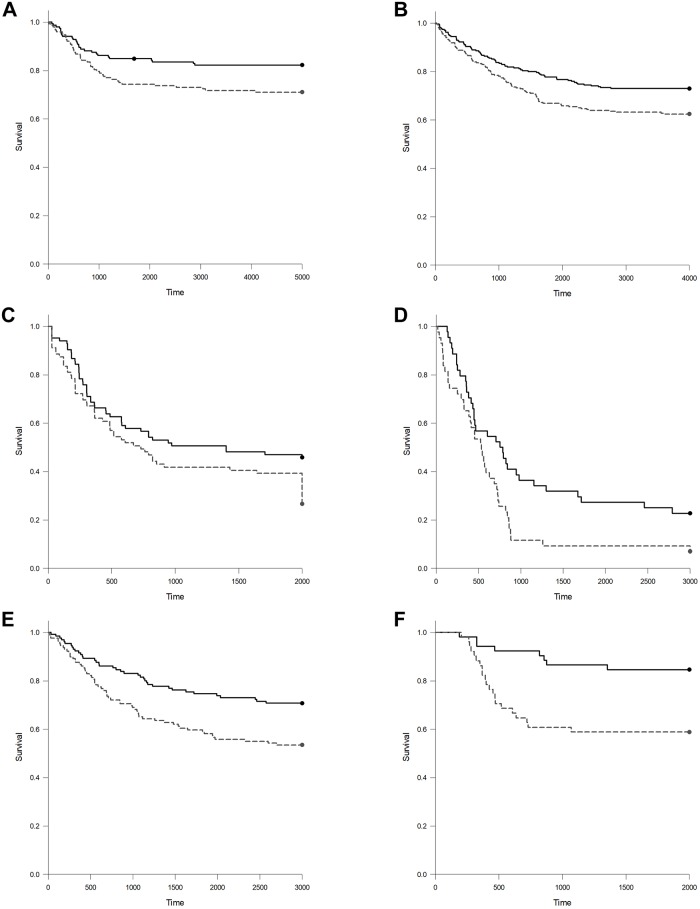
Fig 3. Patients with high levels of DNMT3B7 expression have lower survival rates than those with low expression levels.
The median DNMT3B7 expression for each individual tumor was determined to divide patients with that tumor into “high” (gray, dotted line) and “low” (black, solid line) expression groups. Kaplan-Meier curves were generated and statistical significance was determined for (A) CESC, p = 0.025; (B) KIRC, p = 0.009; (C) LAML, p = 0.035; (D) MESO, p = 0.013; (E) SARC, p = 0.003; and (F) SKCM, p = 0.003.

