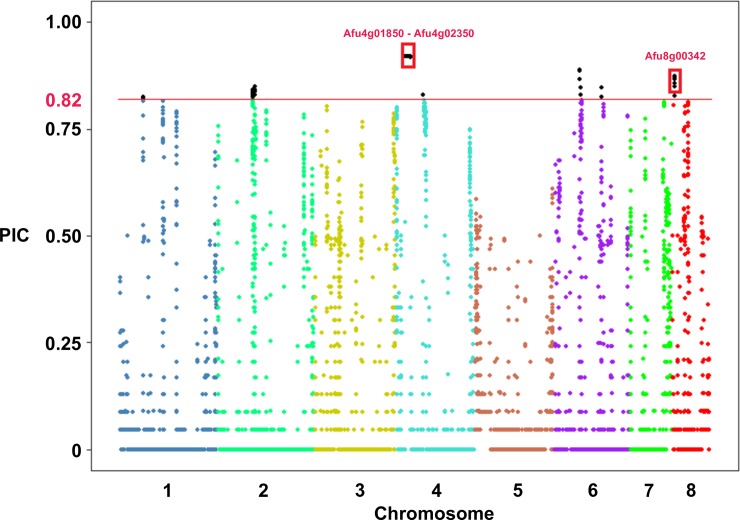
Fig 6. Highly polymorphic copy number variants in A. fumigatus.
Manhattan plot of the Polymorphic Index Content (PIC) value (Y-axis) for each 500 bp non-overlapping window in the genome (x-axis) across the 43 samples from populations 1, 2, and 3. The horizontal red line represents the upper 99% percentile of PIC values. The loci outlined in red boxes on chromosomes 4 and 8 represent the regions that overlapped entire genes.

