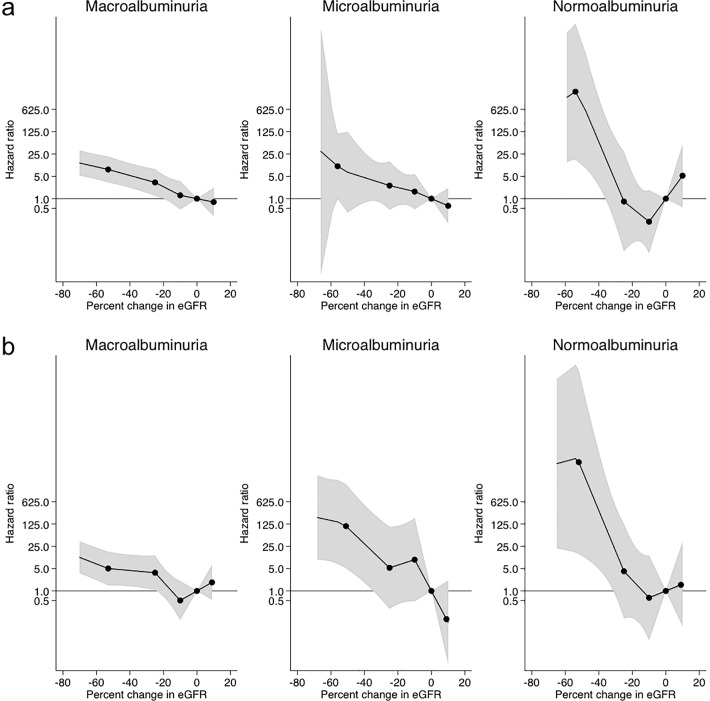
Fig 3.
Adjusted hazard ratios of end-stage renal disease according to percent changes in eGFR during the (a) 2-year or (b) 3-year baseline period in subgroup analysis based on baseline urinary albumin levels. The model was adjusted with gender, age, systolic blood pressure, baseline eGFR, baseline urinary albumin, and history of cardiovascular disease. Knots were placed at −53%, −25%, −10%, and 10%. A reference point was set at 0% change in eGFR. Value trimmed at less than −70% and >10% change in eGFR.

