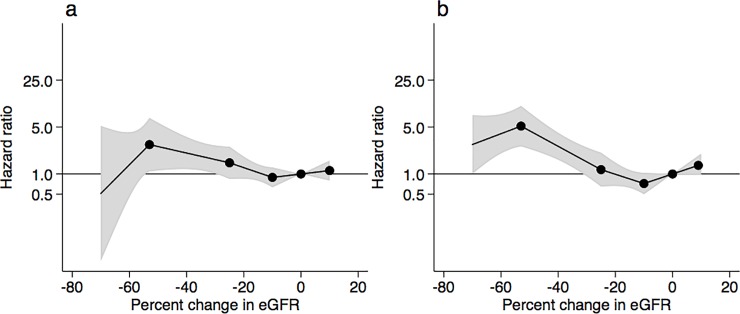
Fig 5.
Adjusted hazard ratios of all-cause mortality according to percent changes in eGFR during the (a) 2-year or (b) 3-year baseline period. The model was adjusted for gender, age, systolic blood pressure, baseline eGFR, baseline urinary albumin, and history of cardiovascular disease. Knots were placed at −53%, −25%, −10%, and 10%. A reference point was set at 0% change in eGFR. Value trimmed at less than −70% and >10% change in eGFR.

