
Fig 2. Changes of omp33-36 mRNA levels during exposure to carbapenems through growth phases.
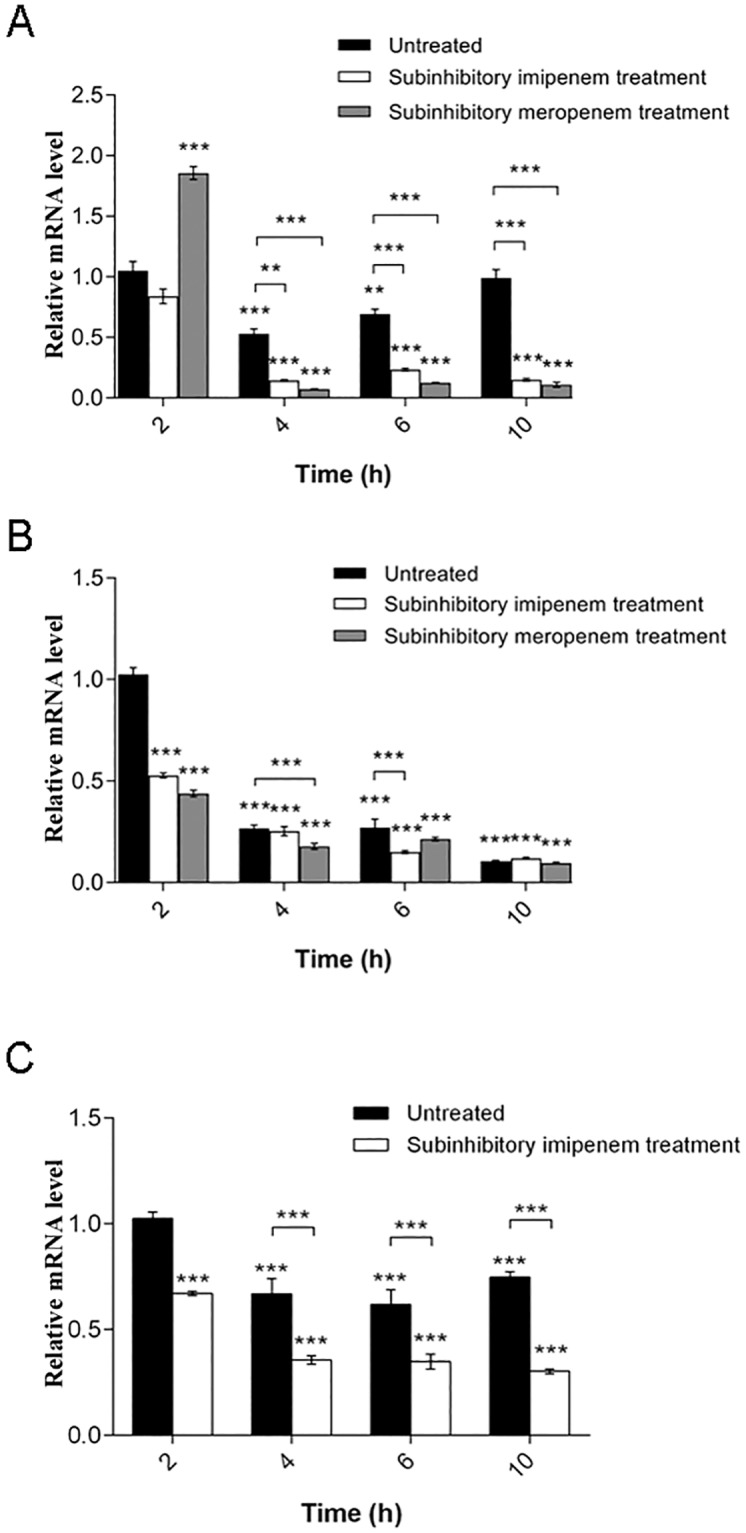
(A) Carbapenem-susceptible strain 813. (B) Carbapenem-resistant strain 1995/12. (C) Carbapenem-resistant strain 4031. All expression results were normalized relative to rpoB by the 2−ΔΔCt method. Values are the means from results obtained in triplicate. Error bars represent the standard deviation of the mean value. One-way ANOVA with Tukey′s post hoc test was used to compare the gene expression results relative to the expression of the omp33-36 gene in the early exponential phase of an untreated strain and to the expression of the untreated strain for each time point (** p< 0.01, *** p< 0.001).