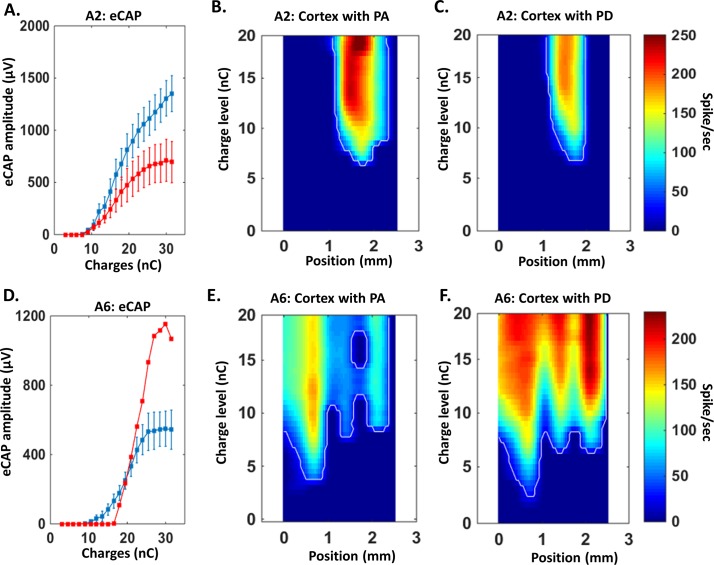
Fig 6. Relationship between eCAP growth function and strength of activation in A1.
A. Mean (+SEM) eCAP growth functions in animal A2 for both strategies of stimulation. As showed in Fig 5, this animal has equivalent thresholds and higher eCAP amplitude with the pulse amplitude strategy (PA) than the pulse duration strategy (PD) leading to a broader dynamic range (see Table 1). B-C. Representation of the spatial activation in the auditory cortex for animal A2 when the charge is increased in the pulse amplitude strategy (B) or the pulse duration strategy (C). The zero position corresponds to the first electrode (most caudal) of the cortical array (inter electrode distance = 350μm). The color code represents the firing rate evolution (in spikes/second, blue = lowest; red = highest) as charge increases (defined by 20 levels of charges, see Methods). Consistent with the effect observed on eCAP growth function (A.), the pulse amplitude strategy elicits a stronger response in the auditory cortex than the pulse duration strategy. D. Mean (+SEM) eCAP growth functions of animal A6 for both strategies of stimulation. As showed in Fig 5, this animal has a higher eCAP amplitude with the pulse duration strategy than the pulse amplitude strategy. E-F. Representation of the spatial activation in the auditory cortex for animal A6 when the charge is increased with the pulse amplitude strategy (E) or the pulse duration strategy (F). Consistent with the effect observed on the eCAP growth function (D.), the pulse duration strategy elicits a stronger response in the auditory cortex than the amplitude duration strategy.

