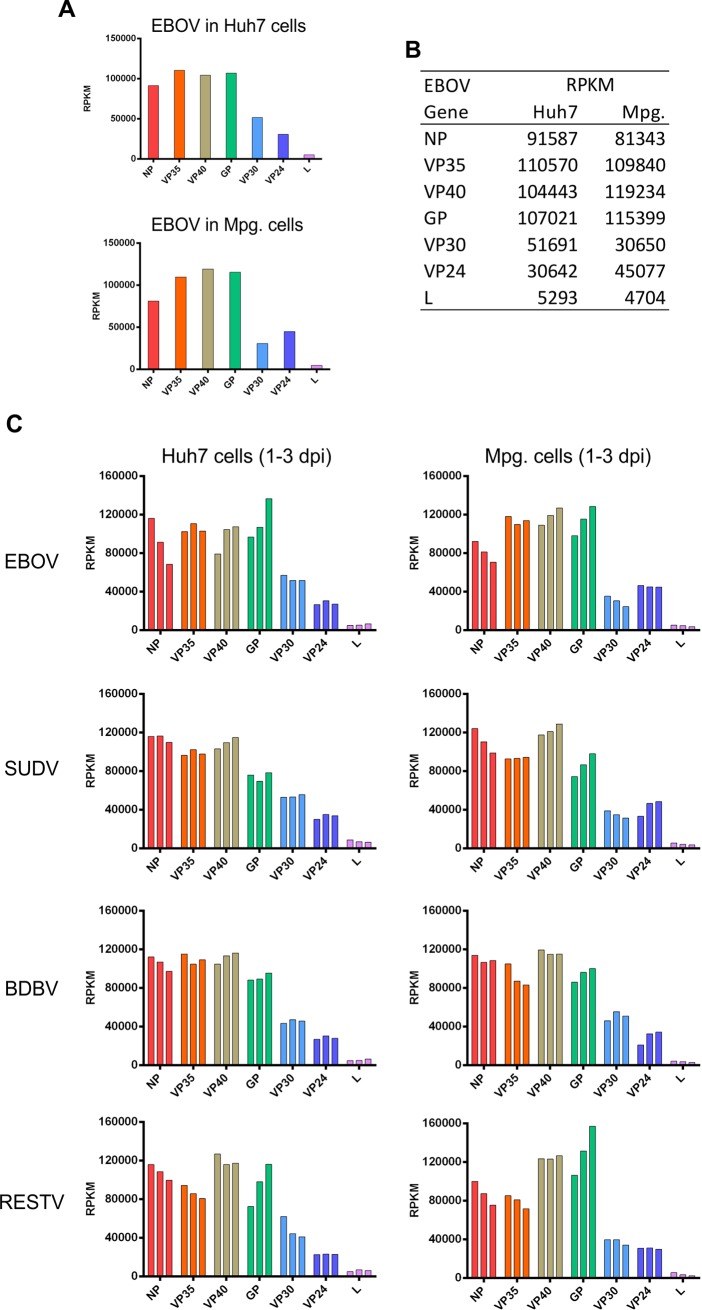
Fig 2.
(A and B) Graphical depiction and table showing the RPKM analysis of EBOV gene levels in infected Huh7 and human macrophage (Mpg) cells. (C) Expression of viral genes during propagation of EBOV, SUDV, BDBV, or RESTV in Huh7 or Mpg cells. Both cell types were infected at moi = 0.1, and harvested at 1, 2, or 3 dpi. For each virus, 3 columns are shown, representing each harvesting day. NGS libraries were designed as in Fig 1.

