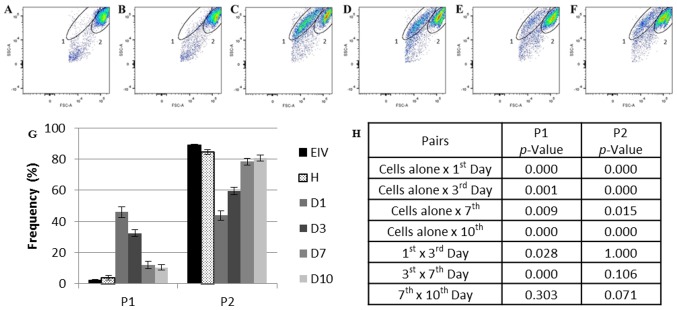
Figure 3.
Flow cytometry analysis of the healthy, endometriotic and co-cultured ECs. (A) Endometriotic ECs cultivated alone prior to co-culture and (B) healthy ECs cultured alone prior to co-culture. (C) Co-cultured ECs at day 1, (D) day 3, (E) day 7 and (F) day 10. (G) Frequency of P1 and P2 during co-culture. (H) Statistical analysis of each population frequency between each day of co-culture and cells cultured alone. The elliptical delimitations 1 and 2 indicate the two populations delimited by differences in size and complexity in each sample. The images are representative for all samples. Data are presented as the mean of each sample group ± standard error. ECs, endometrial cells; EIV, endometriotic ECs; D1, day 1 of co-culture; D3, day 3 of co-culture, D7, day 7 of co-culture; D10, day 10 of co-culture; FSC, forward scatter; H, healthy ECs; P1, population one; P2, population two; SSC, side scatter.

