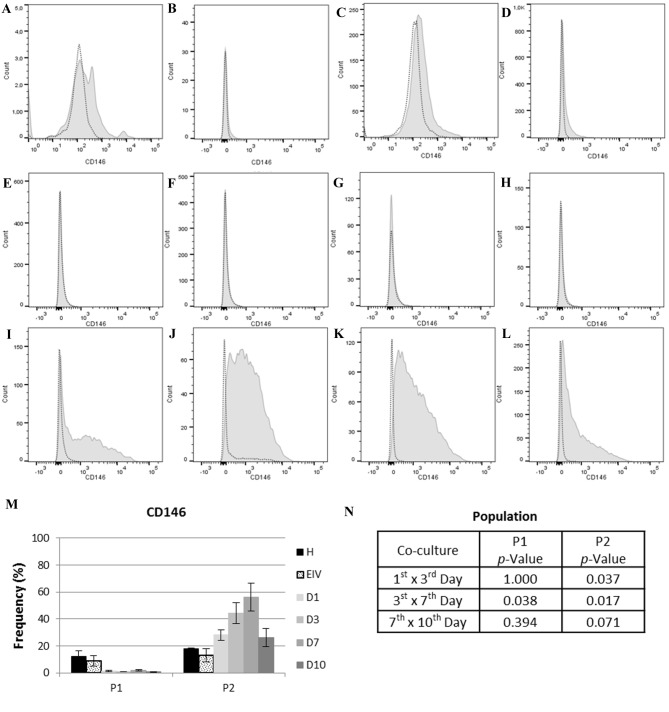
Figure 5.
CD146 expression in cell each population. In the histograms, light gray dotted lines indicate background fluorescence obtained with the isotype control immunoglobulin G1. CD146 expression is represented by the light gray filled areas. The × axis represents fluorescence intensity and the y axis represents cell count. (A) Histogram for CD146 expression in P1 of healthy ECs and (B) EIV. (C) Histogram for CD146 expression in P2 of healthy ECs and (D) EIV. (E) Histogram for CD146 expression on P1 at day 1, (F) day 3, (G) day 7 and (H) day 10 of EC co-culture. (I) Histogram for CD146 expression on P2 at day 1, (J) day 3, (K) day 7 and (L) day 10 of EC co-culture. (M) CD146 expression in each population. (N) Statistical analysis of CD146 expression between each day of co-culture for P1 and P2. Data are presented as the mean of each sample group ± standard error. ECs, endometrial cells; CD146, cell surface glycoprotein MUC18; P1, population one; P2, population two; H, healthy; ECs, EIV, endometriosis ECs; D1, day 1 of co-culture; D3, day 3 of co-culture; D7, day 7 of co-culture; D10, day 10 of co-culture.

