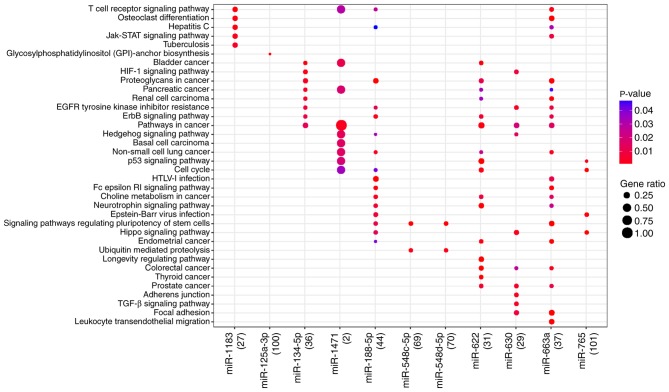
Figure 2.
Enriched pathways for the top 11 differentially expressed miRNAs. Different dot color and dot size represent the P-value and gene ratio, respectively. The number below each miRNA name represents the number of target genes involved in pathway analysis. miR/miRNA, microRNA; STAT, signal transducer and activator of transcription; HIF, hypoxia inducible factor; EGFR, epidermal growth factor receptor; HTLV, human T-lymphotropic virus; TGF, transforming growth factor.

