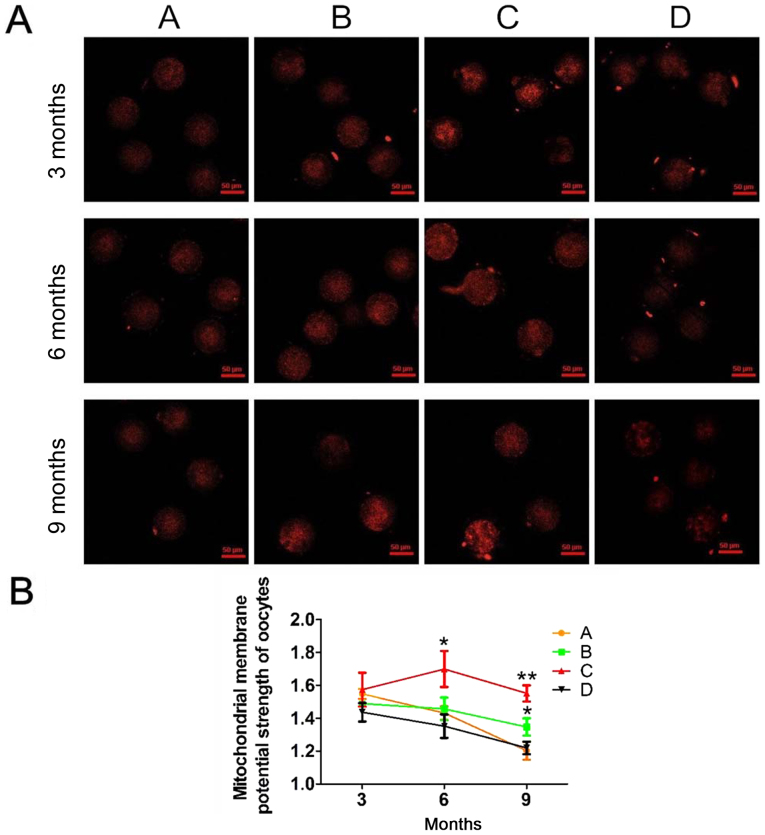
Figure 2.
Fluorescent images of mitochondrial activity in each group at 3, 6 and 9 months. (A) The red fluorescence was evidently weaker in oocytes from older mice when compared with that observed in those from younger mice. Scale bars, 50 µm. (B) The trends in the mitochondrial membrane potential strength of oocytes in each group. A, heavy metal coupling agent group; B, antioxidant group; C, mixed group; and D, normal control group. Following JC-1 staining, red fluorescence in the TRITC channel indicated mitochondrial activity when the membrane potential was activated. Mitochondrial membrane potential strength=mitochondrial activity/apoptosis (the ratio of red to green); the greater the membrane potential strength, the greater the activity. *P<0.05 and **P<0.01 vs. group D.

