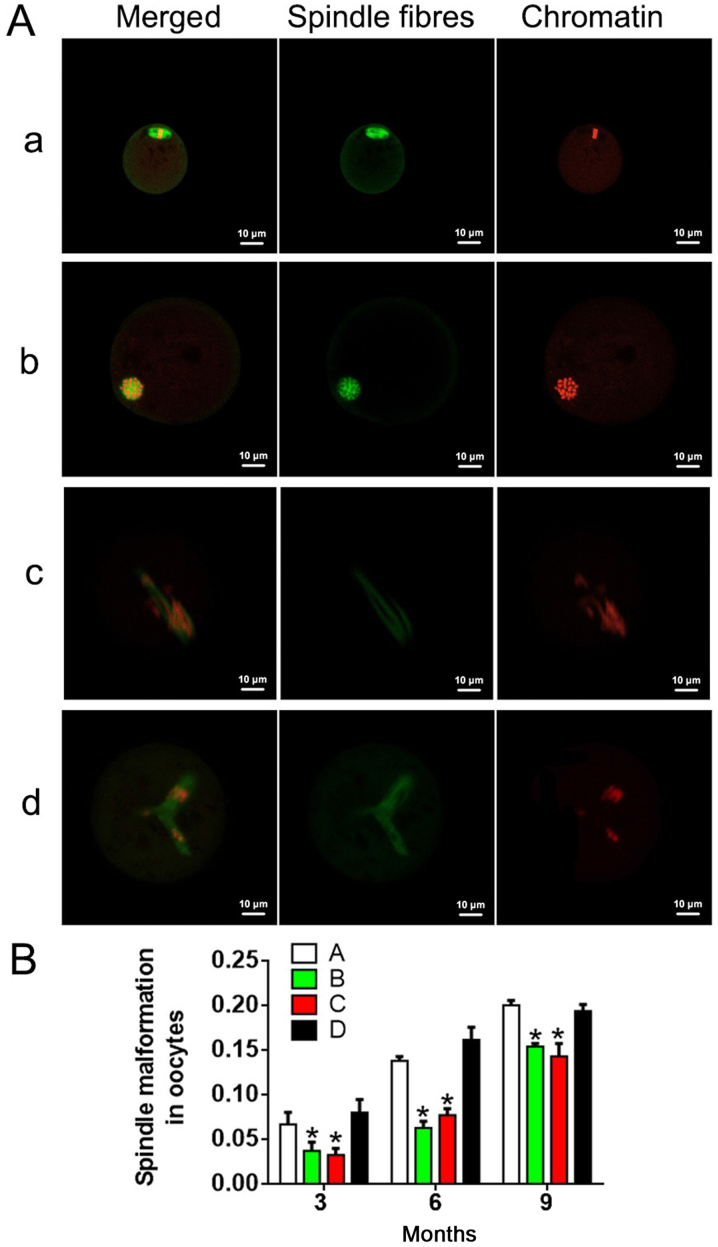
Figure 4.
Fluorescent images of chromosomes and spindle structures in oocytes. (A) Fluorescent images of chromosomes and spindle structures in oocytes: Images a and b present normal spindle and chromosomes; cross-sections are shown in image a, and longitudinal sections are shown in image b. Images c and d present abnormal spindle and chromosomes. Green indicates spindle fibers, and red indicates chromatin. Scale bars, 10 µm. (B) Spindle malformation in oocytes in each group. A, heavy metal coupling agent group; B, antioxidant group; C, mixed group; and D, normal control group. *P<0.05 vs. group D.

