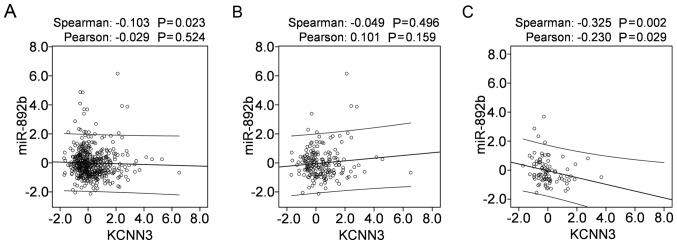
Figure 5.
Correlations between miR-892b and KCNN3 expression in 489 OC tissues from TCGA cohort downloaded from cBioPortal. Correlations between miR-892b and KCNN3 expression in (A) 489 OC tissues, (B) 197 platinum-sensitive tissues and (C) 90 platinum-resistant tissues. Correlations between miR and gene expression were analyzed using bivariate correlations. miR, microRNA; KCNN3, potassium calcium-activated channel subfamily N member 3; OC, ovarian cancer; TCGA, The Cancer Genome Atlas.

