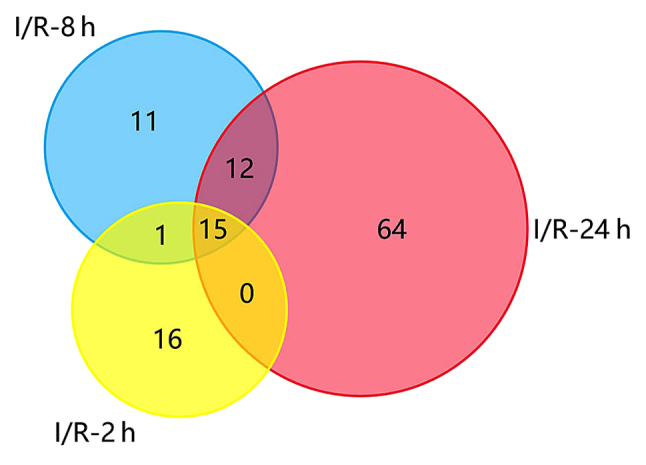
Figure 1.

Venn diagram presenting the DEGs between cerebral I/R and sham control samples at 2, 8 and 24 h post-reperfusion. A total of 15 DEGs were common among all three post-reperfusion time-points. DEGs, differentially expressed genes; I/R, ischemia/reperfusion.
