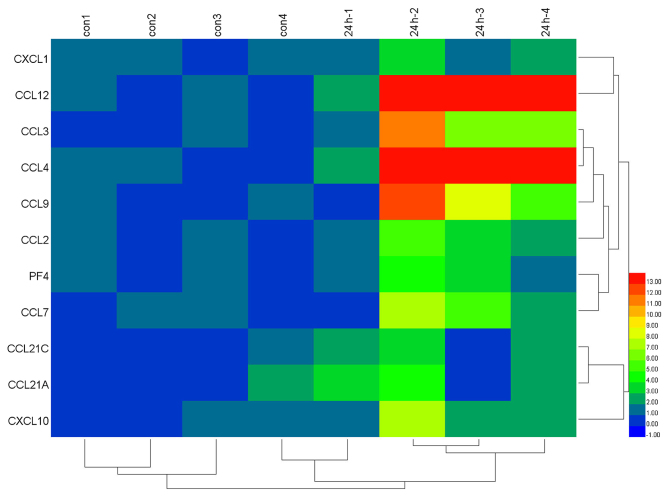
Figure 2.
Heat map illustration of chemokine signaling pathway-associated genes in 24 h post-reperfusion and sham samples. A total of 11 chemokine signaling pathway-associated genes were included. The color code depicts the value of each gene following median normalization, with blue indicating the lowest and red as the highest value.

