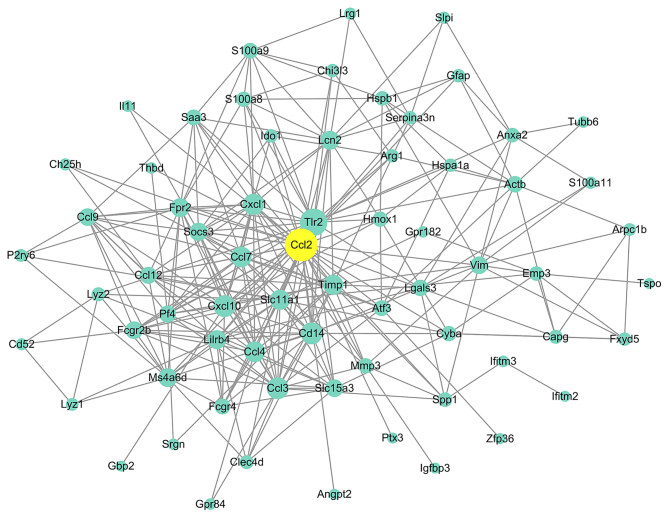
Figure 3.
Protein-protein interaction network for DEGs between cerebral ischemia/reperfusion and sham control samples at 24 h post-reperfusion. Circles represent nodes and lines between nodes represent edges, which indicate DEGs and interactions between two DEGs, respectively. C-C motif chemokine ligand 2 was identified as the hub gene with the highest interaction degree and is indicated in yellow. DEGs, differentially expressed genes.

