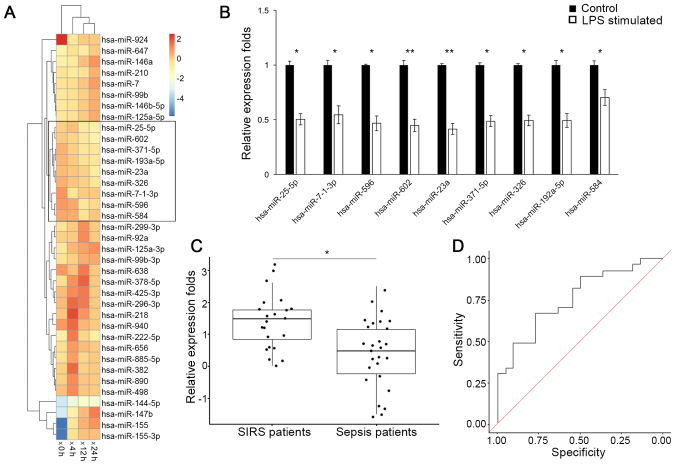
Figure 1.
Expression analysis of miRNAs during the sepsis response. (A) Heat map for clustering analysis of miRNA expression data; 0, 4, 12 and 24 h are the times elapsed following LPS stimulation. (B) Relative expression fold changes of miRNAs following LPS stimulation. Expression levels prior to LPS administration were used as reference values. (C) Relative expression fold-changes of miR-23a in serum from patients with non-infectious SIRS or sepsis. (D) Receiver operating characteristic curve for the measurement of miR-23a in serum to differentiate between non-infectious SIRS and sepsis. *P<0.05, **P<0.01 vs. respective control. miRNA/miR, microRNA; LPS, lipopolysaccharide; SIRS, systemic inflammatory response syndrome.

