Figure 2.
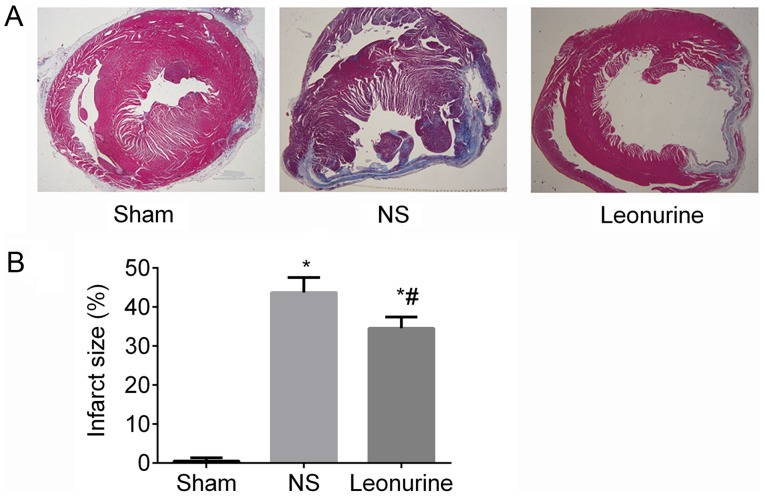
Infarct size 28 days after myocardial infarction. (A) Representative pictures of left ventricles from each group after Masson's Trichrome staining (magnification, ×10). (B) Infarct size as percentages at 28 days. Infarct size is calculated from the ratio of surface area of infarct wall and the entire surface area of the left ventricle. The data are expressed as the mean ± standard deviation. *P<0.05 vs. sham, #P<0.05 vs. NS. n=6 in each group. NS, saline group.

