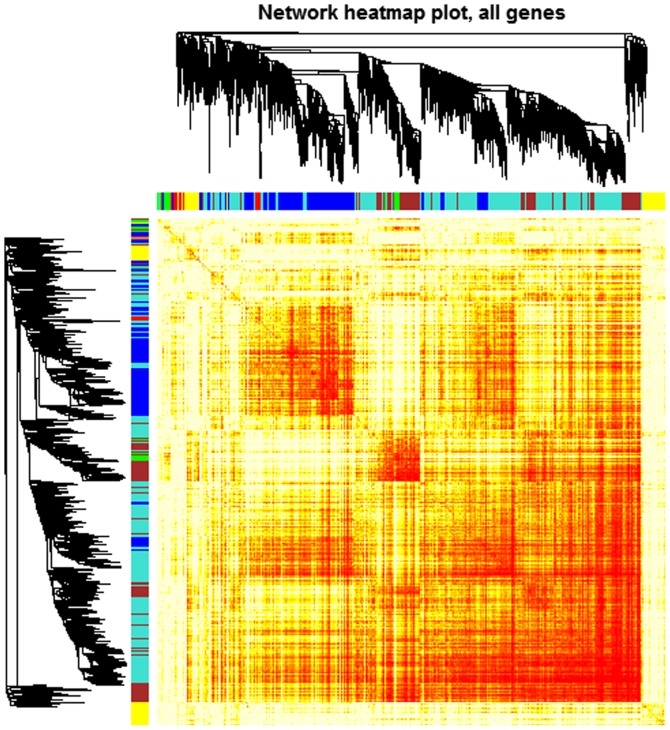
Figure 2.
Heatmap of the gene coexpression network. The heatmap descriped adjacencies among genes in the analysis. A single gene correspond to each row and column of the heatmap. Low adjacencies are indicated by yellow colour and higher adjacencies are indicated by progressively red colour. The genes in the analysis were clustered in modules labeled by a color code (blue, yellow, brown, green and turquoise), which are shown by squares under gene dendrogram along the diagonal.

