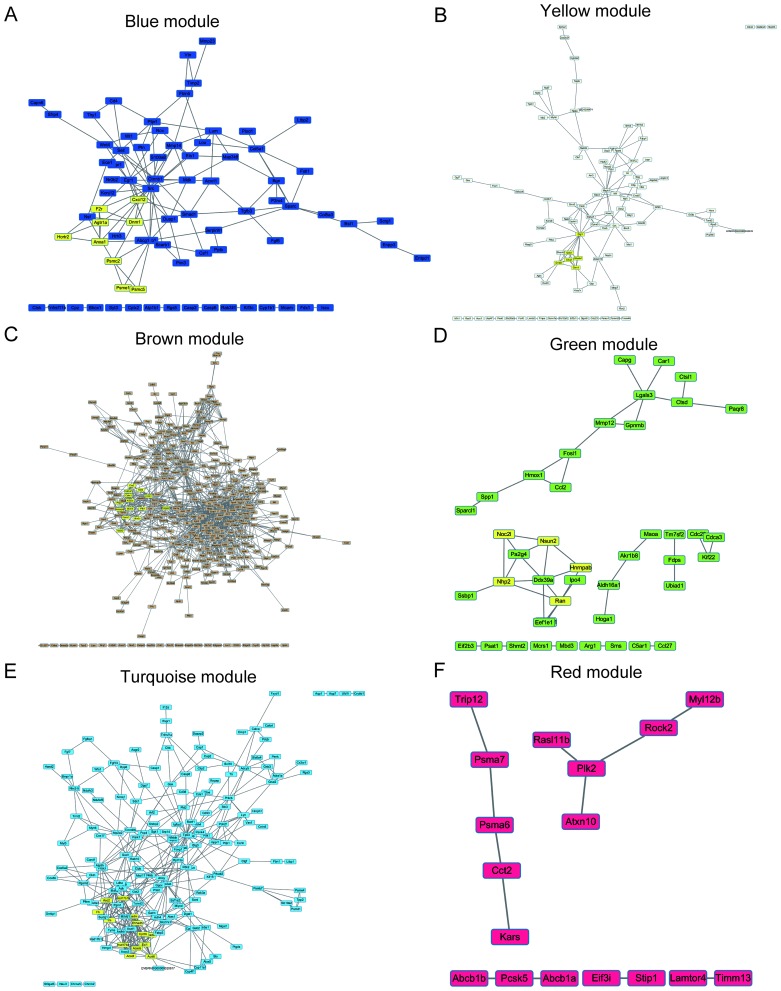
Figure 6.
Protein-protein interaction network of the differentially expressed genes in each module. The nodes indicate proteins. The edges indicate interactions between proteins. Highlighted yellow nodes represent molecular complexes identified by molecular complex detection algorithm of cytoscape software. Core protein-protein interaction networks were shown here for (A) blue, (B) yellow, (C) brown, (D) green, (E) turquoise, and (F) red modules.

