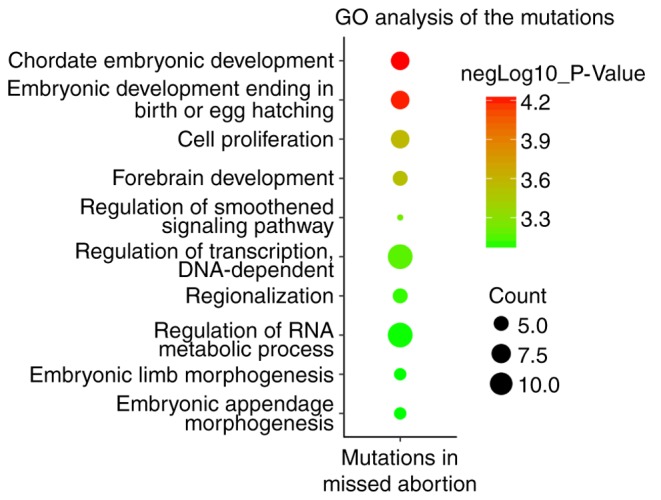
Figure 1.

GO analysis of the 36 genes. GO analysis was performed using the DAVID Bioinformatics Resources 6.7 (https://david-d.ncifcrf.gov/). The Log10 (P-value) was calculated. Red indicates higher significance and enrichment, while green indicates relatively lower enrichment. The size of each circle indicates the gene numbers enriched in each biological process. GO, gene ontology.
