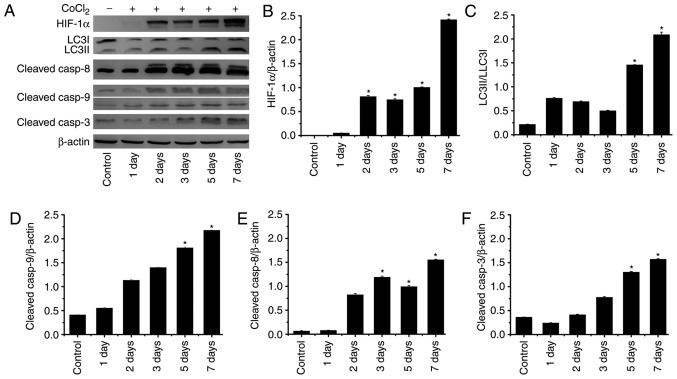
Figure 6.
Expression levels of proteins associated with autophagy and apoptosis in RLE-6TN cells induced by CoCl2. (A) Western blot analysis of HIF-1α, LC3I/II, cleaved caspase-8, cleaved caspase-9 (the upper band=37 kDa, the lower band=17 kDa) and cleaved caspase-3 expression in RLE-6TN cells of each group. Quantification of (B) HIF-1α, (C) LC3I/II, (D) cleaved caspase-8, (E) cleaved caspase-9 and (F) cleaved caspase-3 by densitometry. *P<0.05 vs. control. HIF-1α, hypoxia-inducible factor 1α; LCI/II, microtubule associated proteins 1A/1B light chain 3B; casp, caspase; CoCl2, cobalt (II) chloride.

