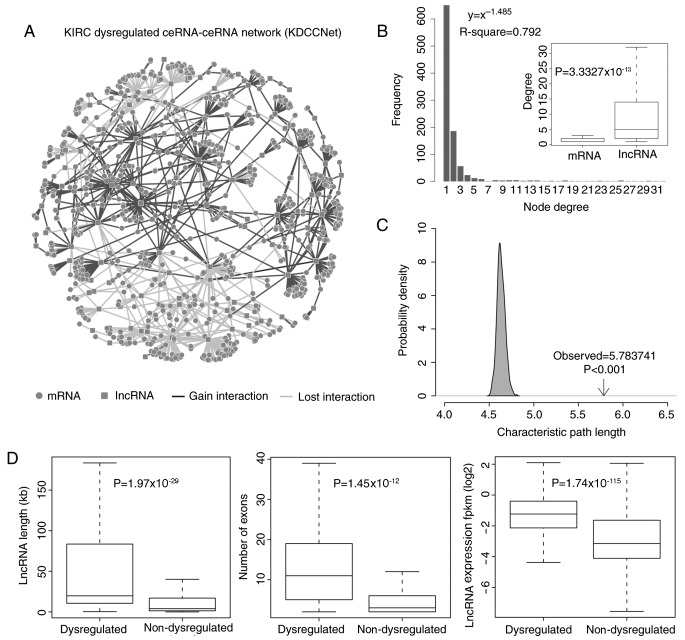
Figure 1.
Layout of KDCCNet and its structural features. (A) The KDCCNet generated in the present study. A circular node marks an mRNA, a square node marks an lncRNA, a dark gray edge represents a gain dysregulation between ceRNAs and a light gray edge represents a lost dysregulation between ceRNAs. (B) Degree distribution of the KDCCNet. Degree distribution of lncRNAs and mRNAs (t test, P-value=3.33×10⁻¹³). (C) The characteristic path length of dysregulated network is increased when compared with the random networks. (D) The boxplot depicts the expression level, the transcript length and the number of exons of dysregulated and non-dysregulated lncRNAs. Significance tests based on the Students t-test. lncRNA, long noncoding RNA; ceRNA, competitive endogenous RNA; KDCCNet, clear cell kidney carcinoma dysregulated ceRNA-ceRNA network; fpkm, fragments per kilobase of transcript per million mapped reads.

