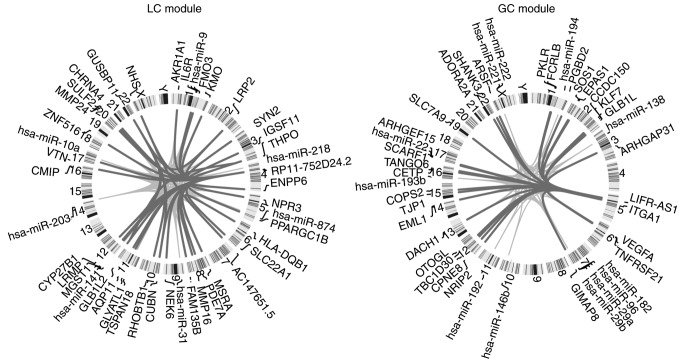
Figure 3.
Chromosomal location of the ceRNA and miRNA regulators of typical modules. Chromosomal ideograms of ceRNAs and miRNA regulators of the two typical modules demonstrated that they were distributed on different chromosomes. A dark gray linking line represents a positive correlation between two RNAs, while a light gray linking line represents a negative correlation between two RNAs. miRNA, microRNA; ceRNA, competitive endogenous RNA; GC, gain ceRNA; LC, loss ceRNA.

