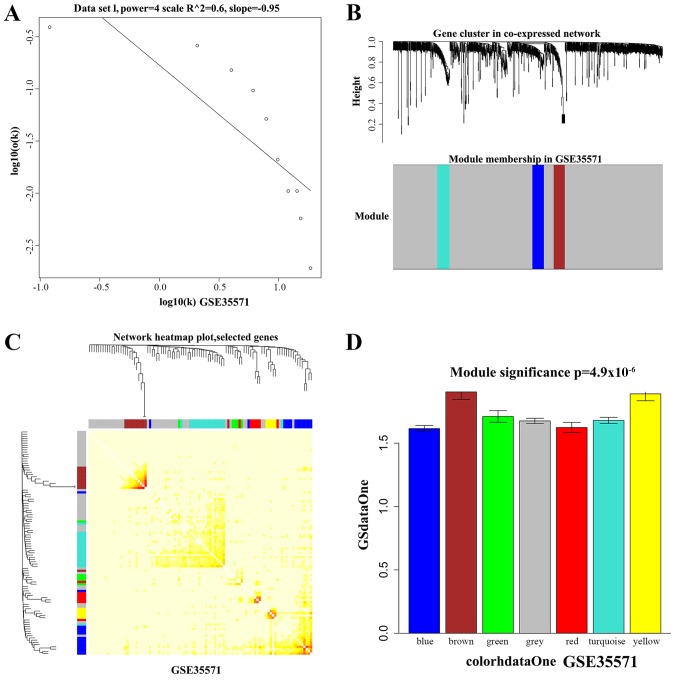
Figure 3.
Gene co-expression modules analysis of GSE35571. (A) Soft threshold setting in the co-expression network. The x-axis represents gene degrees k, and the y-axis represents the ratio of genes p (k). (B) Hierarchical clustering heatmap of DEGs in co-expression network. (C) Hierarchical clustering heatmap showed the inner correlation between these function modules. (D) The GO enrichment analysis of DEGs in modules. The x-axis represents DEGs of modules and the y-axis represents the significance of GO analysis. DEGs, differentially expressed genes; GO, Gene Ontology.

