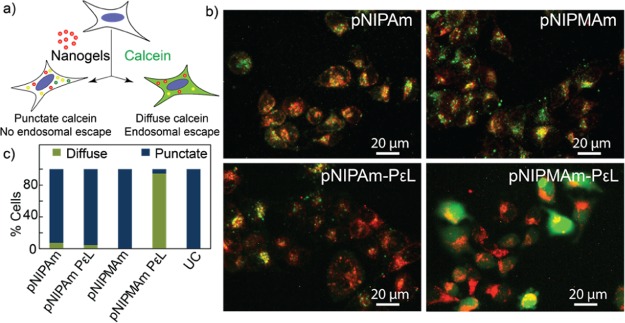
Figure 3.
(a) Schematic for the calcein assay for endosomal escape. (b) Endosomal escape analysis of PεL adsorbed nanogels by fluorescence microscopy using HeLa cells. (c) Quantification of endosomal escape by image analysis. UC: untreated cells. Magnification: 20×. Note: p(NIPMAm-co-NIPAm) is denoted as pNIPMAm.

