
Fig 5.
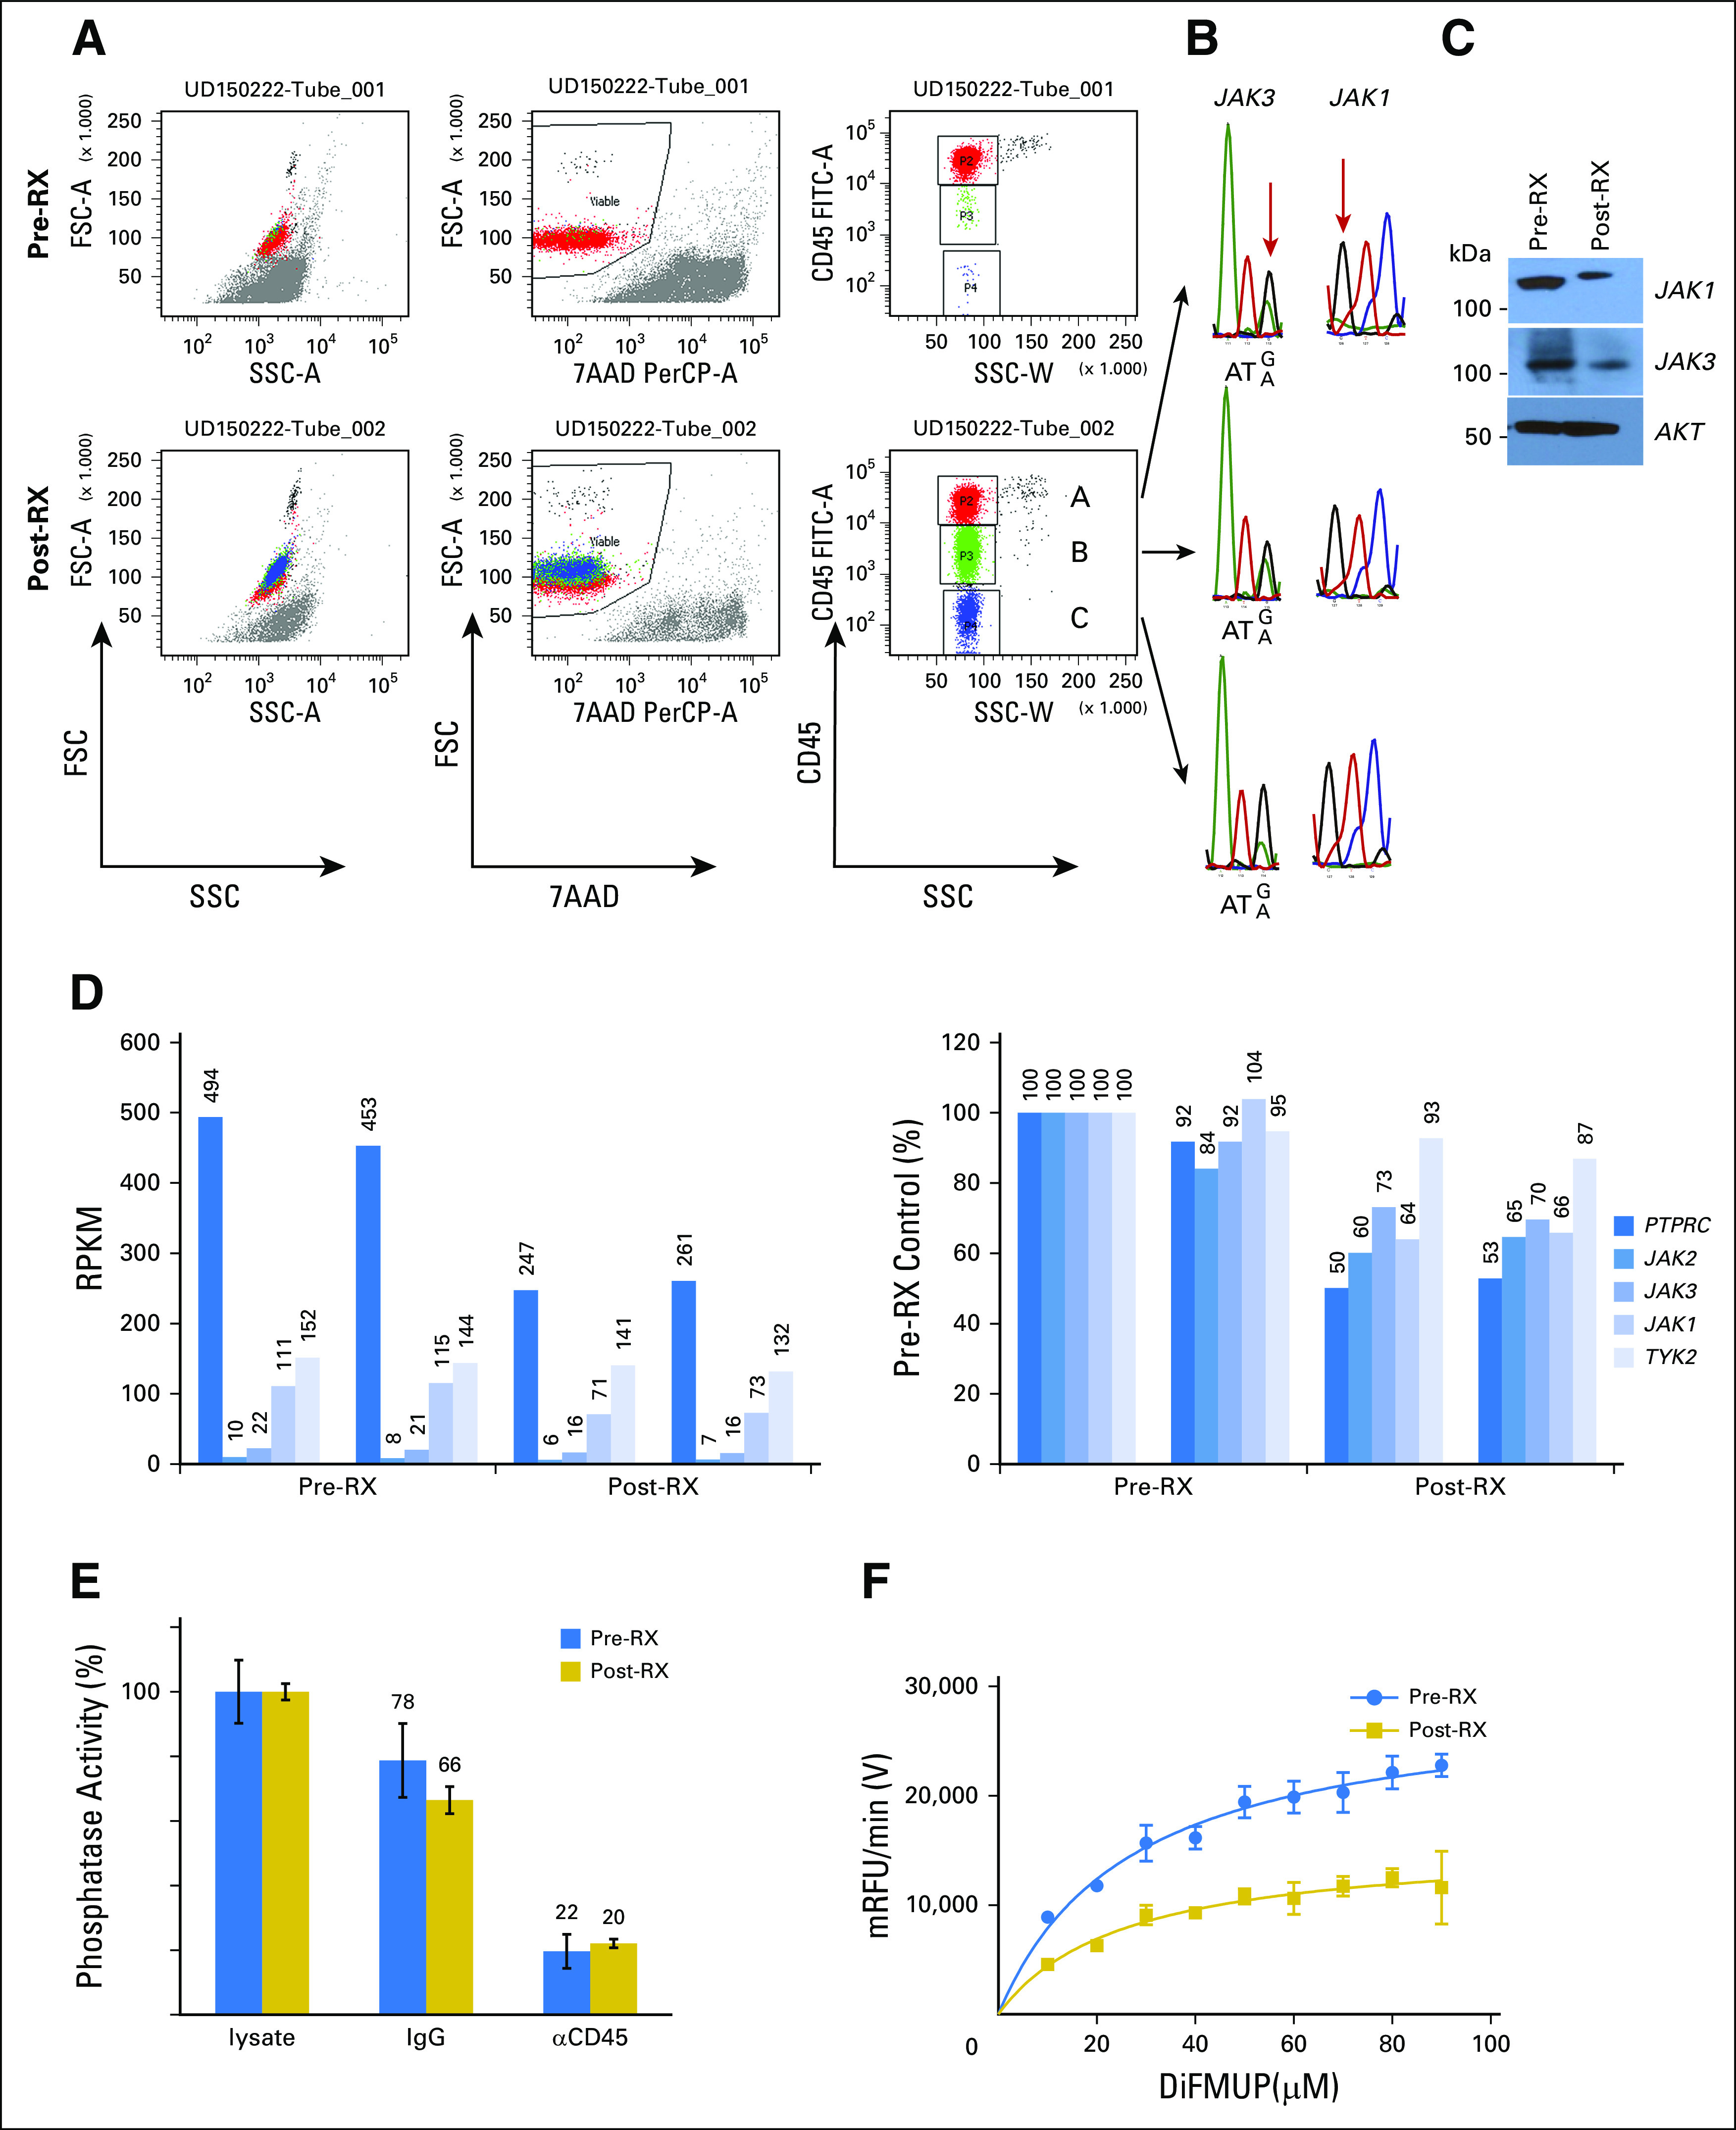
Clinical resistance correlates with downregulation of CD45 protein, mRNA, and phosphatase activity. (A-C) Flow cytometry dot plots show (A) staining patterns of T-cell prolymphocytic leukemia (T-PLL) cells before (pre-RX) and after (post-RX) ruxolitinib treatment/relapse for forward scatter (FSC) and side scatter (SSC), 7-aminoactinomycin D (7-AAD), and anti-CD45. Three distinct populations were noted on the basis of CD45 expression; (B) cells were flow sorted, extracted for genomic DNA, subjected to polymerase chain reaction for relevant exons, and sequenced. (C) Western blot analysis of pre-RX and post-RX/relapse T-PLL cells for total JAK1, JAK3, and AKT proteins. (D) RNA-seq results for PTPRC, JAK2, JAK3, JAK1, and TYK2. Vertical line separates pre-RX and post-RX/relapse samples; both were analyzed in duplicate. Left panel, RPKM for T-PLL, reads per kilobase of gene per million reads; right panel, RPKM normalized to pre-RX reads (set at 100%). (E) Bar graphs show measured in vitro phosphatase activity from cytosolic lysates prepared from T-PLL cells before (blue) and after (gold) ruxolitinib. The second set of assays was done after pull down with isotype control IgG/protein A/G. The third set of assays was done after incubation with anti-CD45/protein A/G; values were normalized to cytosolic lysates before immunodepletion (set at 100%); error bars show standard error of the mean from quadruplicates. (F) Graph shows a kinetic phosphatase assay of cytosolic lysates prepared from pre-RX and post-RX/relapse T-PLL cells. The x-axis shows varying concentrations of phosphatase substrate, DiFMUP (6, 8-difluoro-4-methylumbiliferyl phosphate), in micromolar; the y-axis, velocity of product formation in mRFU/min.