
Fig 6.
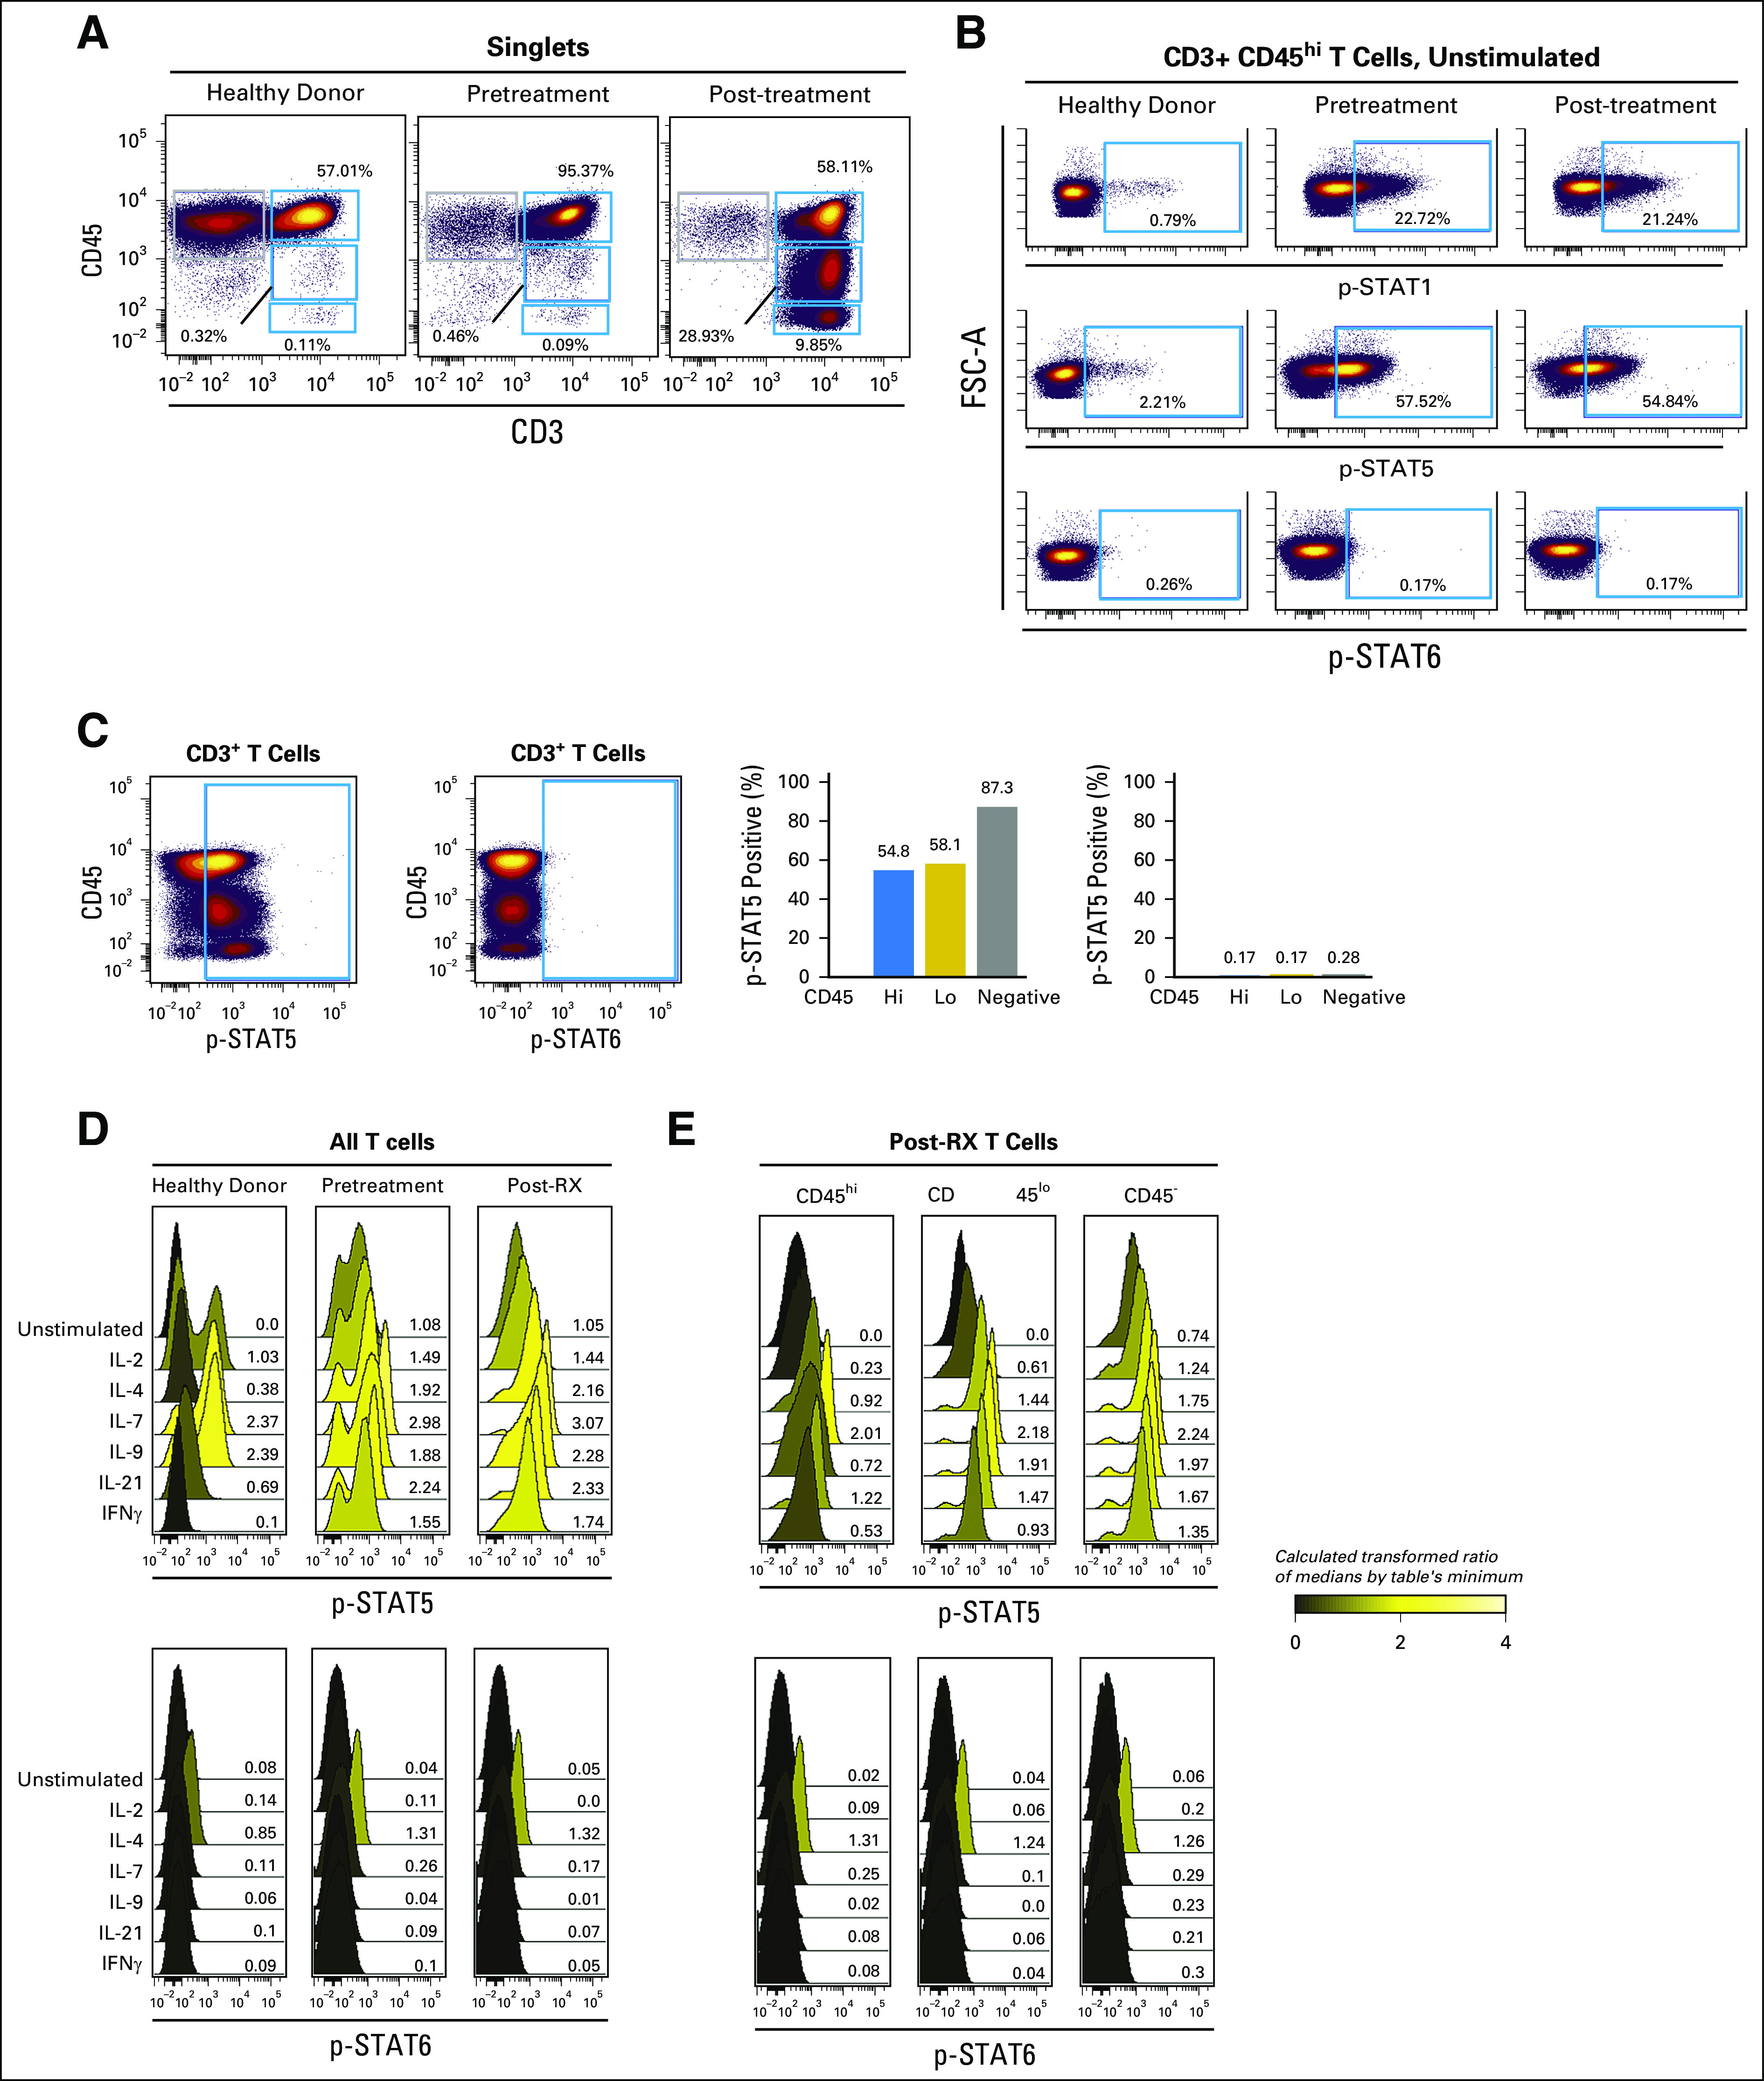
T-cell prolymphocytic leukemia (T-PLL) cells have constitutive phospho-STAT1 (p-STAT1) and p-STAT5. Intracellular signaling responses, monitored by using phospho-flow cytometry, of peripheral-blood mononuclear cells (PBMCs) from healthy donors, and from the patient with T-PLL before (pretreatment) and after (post-treatment) relapse experienced during ruxolitinib treatment. (A) Biaxial plots show expression of CD45 and CD3 on healthy donor and T-PLL samples. Blue gates indicate populations defined by expression of CD45 (hi, lo, and negative). CD3+ included peripheral T cells in health donor and all T-PLL cells. (B) Biaxial plots show basal p-STAT-1, p-STAT5, and p-STAT6 in CD3+ CD45hi cells. (C) Biaxial plot shows CD45 versus p-STAT5 and p-STAT6 at the time of relapse. Right panel, bar graph of percentage of cells with p-STAT5 or p-STAT6 for cells that express CD45hi, CD45lo, and CD45neg. (D) Graphs show p-STAT5 and p-STAT6 for health donor T cells, pretreatment T-PLL, and post-treatment T-PLL unstimulated or after 15 minutes of cytokine stimulation at 20 ng/mL.(E) Similar graphs of cytokine-stimulated p-STAT5 and p-STAT6 for post-treatment T-PLL cells with CD45hi, CD45lo, or CD45neg gating. Values are from median fluorescent intensities that were ArcSinh transformed and expressed as a fold change from the table’s minimum value. Graphs are shaded from black to yellow to reflect ratios from zero to four, as shown by the scale. Y-axes show counts, and x-axes show fluorescence.