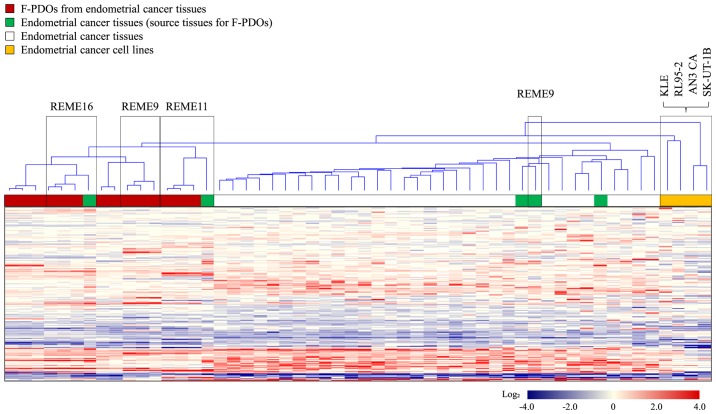
Figure 2.
Gene expression profiles of F-PDOs, endometrial tumors and endometrial cancer cell lines. Expression values (subtracted log ratios) are represented by color gradients. Red and blue colors indicate high and low expression, respectively. White indicates a log ratio of 0. F-PDO, Fukushima patient-derived organoid.

