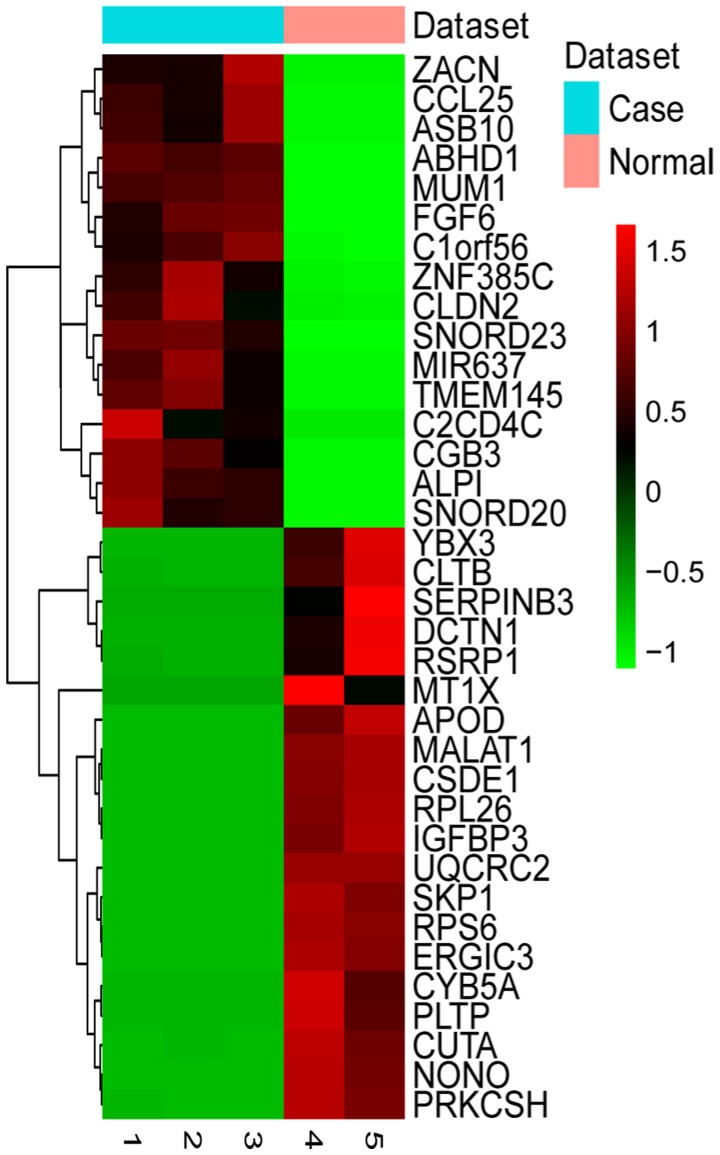
Figure 1.
Hierarchical clustering analysis based on the expression profile of the top 20 DEGs in HPSCC compared to adjacent normal tissues. Turquoise and pink indicate the HPSCC and adjacent normal tissues, respectively. Red represents the relative expression level of genes that was higher than the mean expression level, and green represents the relative expression of genes that was lower than the mean expression level. DEGs, differentially expressed genes; HPSCC, hypopharyngeal squamous cell carcinoma.

