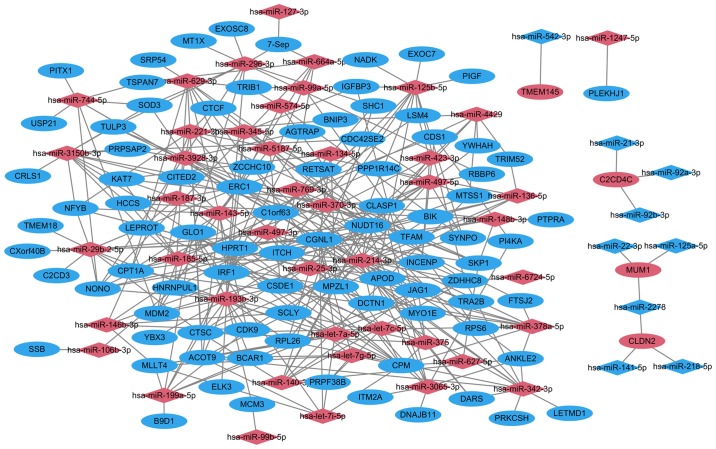
Figure 2.
miRNA target network between DEGs and differentially expressed miRNAs in HPSCC. Diamond and ellipse shapes represent the miRNAs and target genes, respectively. Red and blue represent upregulation and downregulation, respectively. DEGs, differentially expressed genes; HPSCC, hypopharyngeal squamous cell carcinoma; miRNA, microRNA.

