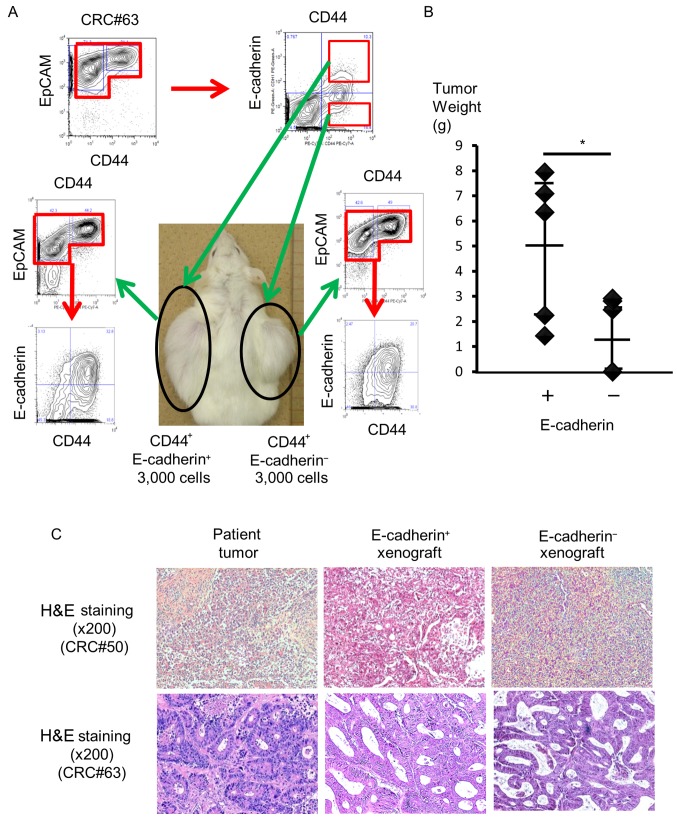
Figure 3.
Higher tumorigenic potential of E-cadherin+ colorectal CSCs. (A) Image of a mouse bearing a xenograft tumor from EC+ and EC− colorectal CSCs and flow cytometric analyses of their phenotype. (B) Tumor weight of xenograft tumors. Error bars represent the 95% confidence interval. EC+ colorectal CSCs produced significantly larger tumors compared to EC− colorectal CSCs. *P<0.01 (C) Histopathological analysis of xenograft tumors from EC+ CSCs and EC− CSCs.

