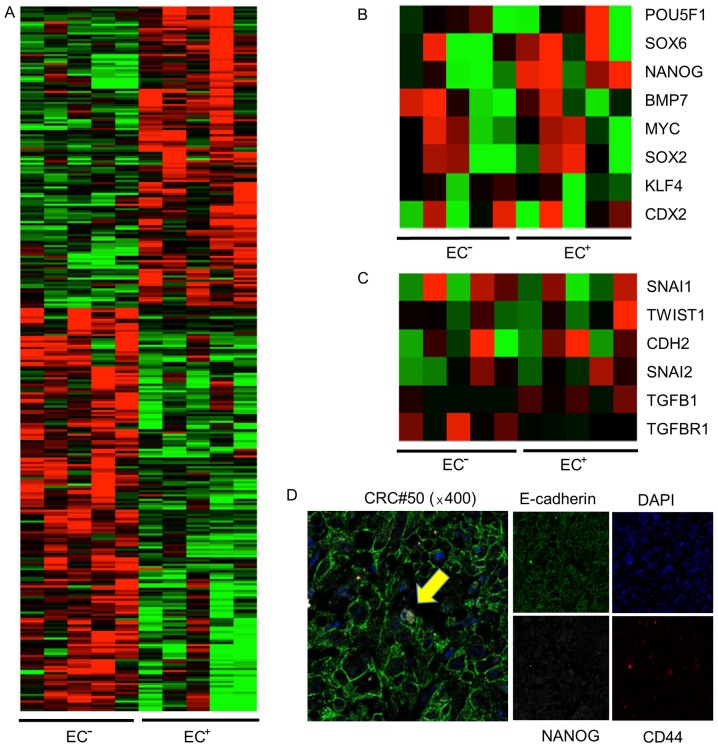
Figure 4.
Upregulation of NANOG expression in EC+ CSCs. cDNA microanalysis of (A) total gene expression, (B) transcription-related (including NANOG) gene expression, and (C) EMT-related gene expression in EC+ and EC− CSCs. (A) Total gene expression differed between EC+ CSCs and EC− CSCs. (B) NANOG expression was significantly upregulated in EC+ CSCs vs. EC− CSCs. (C) Expression of genes related to EMT did not differ between EC+ CSCs and EC− CSCs. (D) Immunofluorescence staining of a human colorectal cancer specimen. NANOG was expressed in the nucleus of CD44 and E-cadherin double-positive colorectal cancer cells (yellow arrow).

