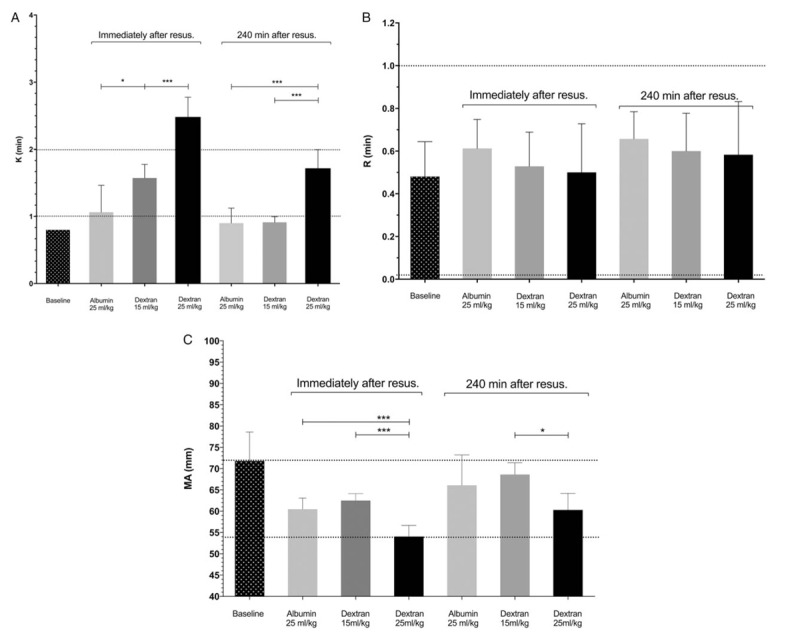
Fig. 3.
Reaction time (K, A), speed of clot amplification (R, B) and maximal amplitude (MA, C) as measured using thrombelastography in the albumin and dextran groups at baseline (before the start of hemorrhage) and at the completion of resuscitation and 4 h after the completion of resuscitation with albumin at a dose of 25 mL/kg (n = 8) or dextran at a dose of 15 mL/kg (n = 7) or 25 mL/kg (n = 6).

Normal human limits for respective parameter are indicated with the dotted lines (36). ∗ = P < 0.05, ∗∗ = P < 0.01, ∗∗∗ = P < 0.001 (one-way ANOVA followed by Turkey's adjustment for multiple comparisons).
