
Fig. 4.
Effect of EA (A) micrographs of lung H&E staining.
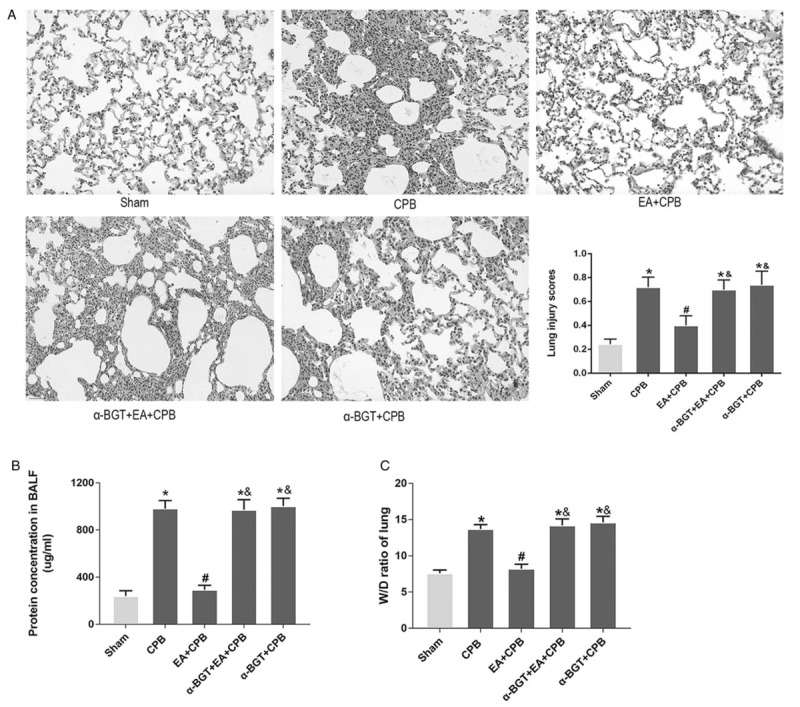
The lung structures of the sham and EA+CPB groups were similar. Lung inflammatory response is very obvious in the CPB group as well as in α-BGT+EA+CPB group and the α-BGT+CPB group. Lung injury scores showed similar results. Magnification 200 × . (B) Protein concentrations in BALF quantified by BCA protein assay. The sham and EA+CPB groups are similar and low. The concentration is significantly higher in the CPB group as well as in the α-BGT+EA+CPB and α-BGT+CPB group. (C) W/D ratios of lung tissue. The W/D ratios of the sham and EA+CPB groups are similarly very low. The W/D ratio in the CPB group is significantly higher than that of the sham and EA+CPB groups, whereas it is similar in the α-BGT+EA+CPB and α-BGT+CPB groups. Data are means ± SD (n = 6 per group). ∗P < 0.01 vs. sham group; #P < 0.01 vs. CPB group; &P < 0.01 vs. EA+CPB group.