
Fig. 6.
HMGB1 concentrations in serum and BALF.
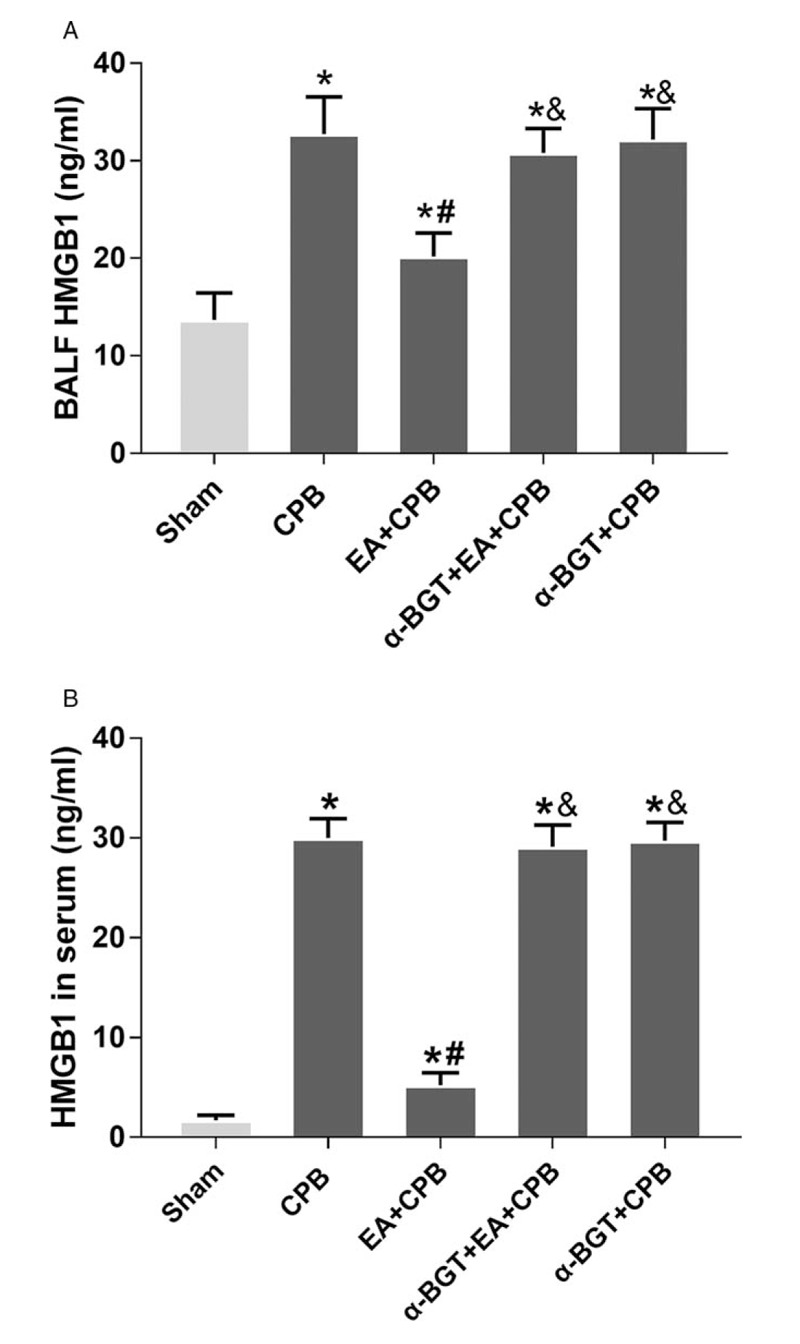
In both serum (A) and BALF (B), HMGB1 concentrations were significantly higher in the CPB group compared with the sham groups. In the EA+CPB group, HMGB1 concentrations were significantly reduced compared with the CPB group, whereas the a7nAChR antagonist a-BGT attenuated the reduction. Data are means ± SD (n = 6 per group). ∗P < 0.01 vs. sham group, #P < 0.01 vs. CPB group; &P < 0.01 vs. EA+CPB group.