Figure 1.
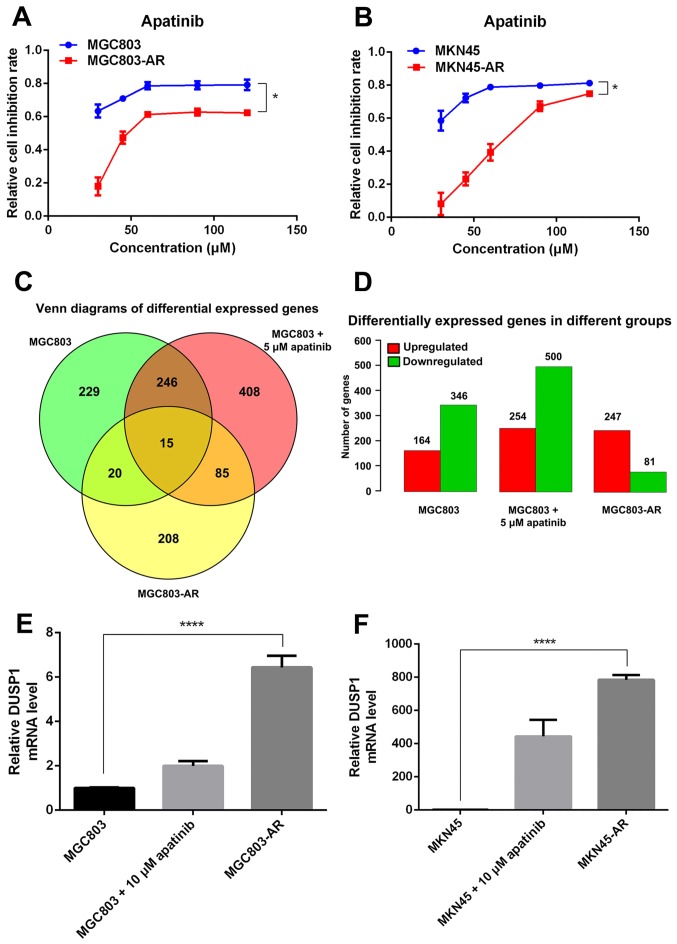
Expression of DUSP1 is upregulated in AR gastric cancer cells. (A) MGC803, MGC803-AR, (B) MKN45 and MKN45-AR cells were treated with various concentrations of Apa and the cell inhibition rate was determined using the Cell Counting Kit-8 assay 24 h following the start of Apa treatment. Data are presented as the mean ± standard deviation (n=5). *P<0.01 between sensitive and resistant cells at all concentrations. (C) MGC803 and MGC803 cells treated with 5 µM Apa for 24 h and MGC803-AR were used for whole genome sequencing, and resulting differentially expressed genes are shown in a Venn diagram. (D) Expression of differentially expressed genes between groups was increased or decreased as indicated. (E) MGC803 and (F) MKN45 cells were incubated with a concentration gradient of Apa for 24 h, then exposed to the corresponding AR cells. Reverse transcription-quantitative polymerase chain reaction analysis was performed to determine mRNA expression levels (n=4; Student's t-test; *P<0.05, ****P<0.0001). DUSP1, dual-specificity phosphatase-1; Apa, apatinib; AR, Apa-resistant.

