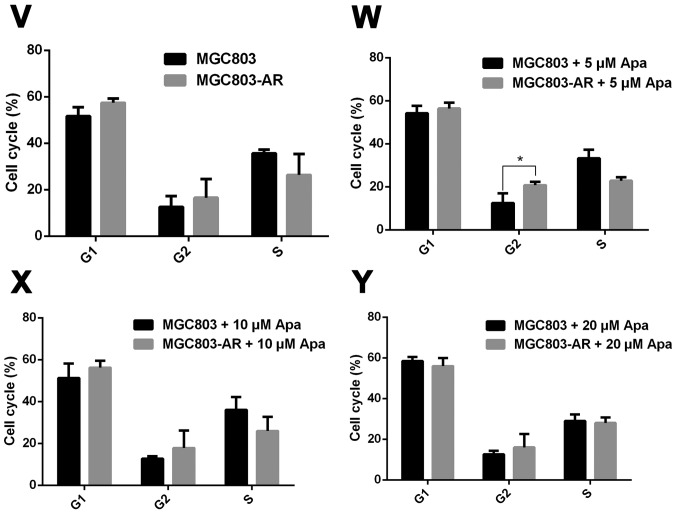
Figure 3.
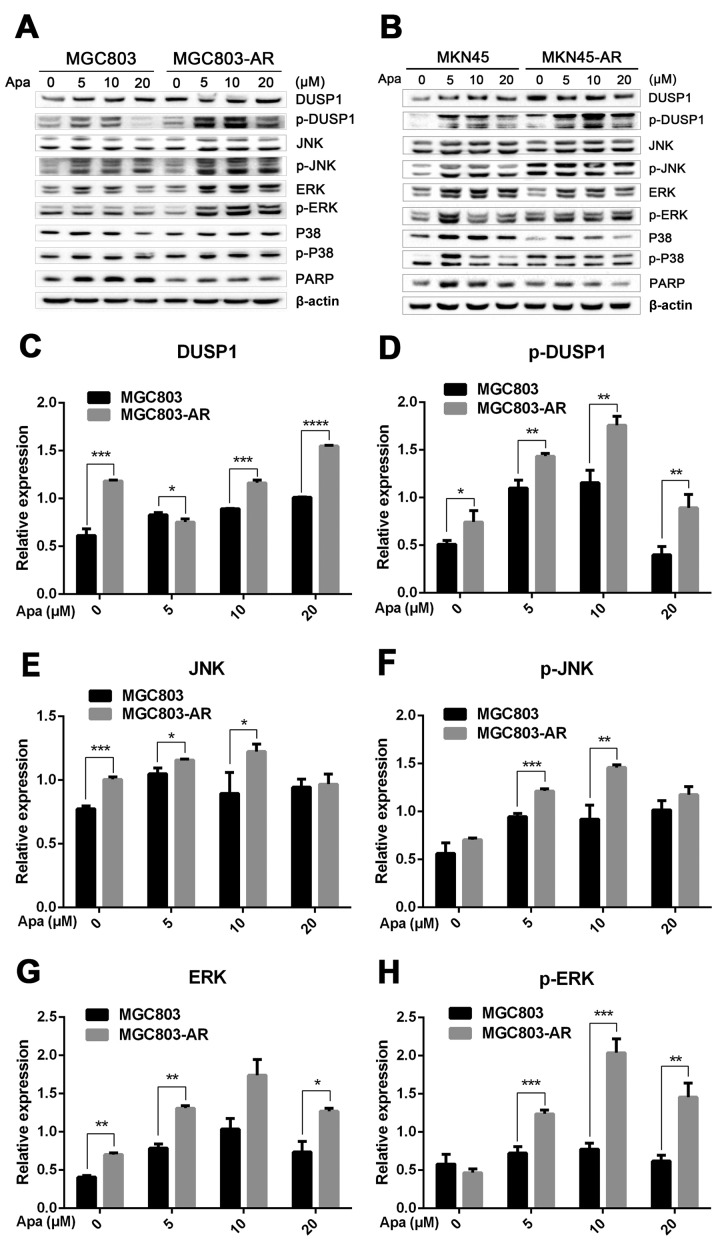
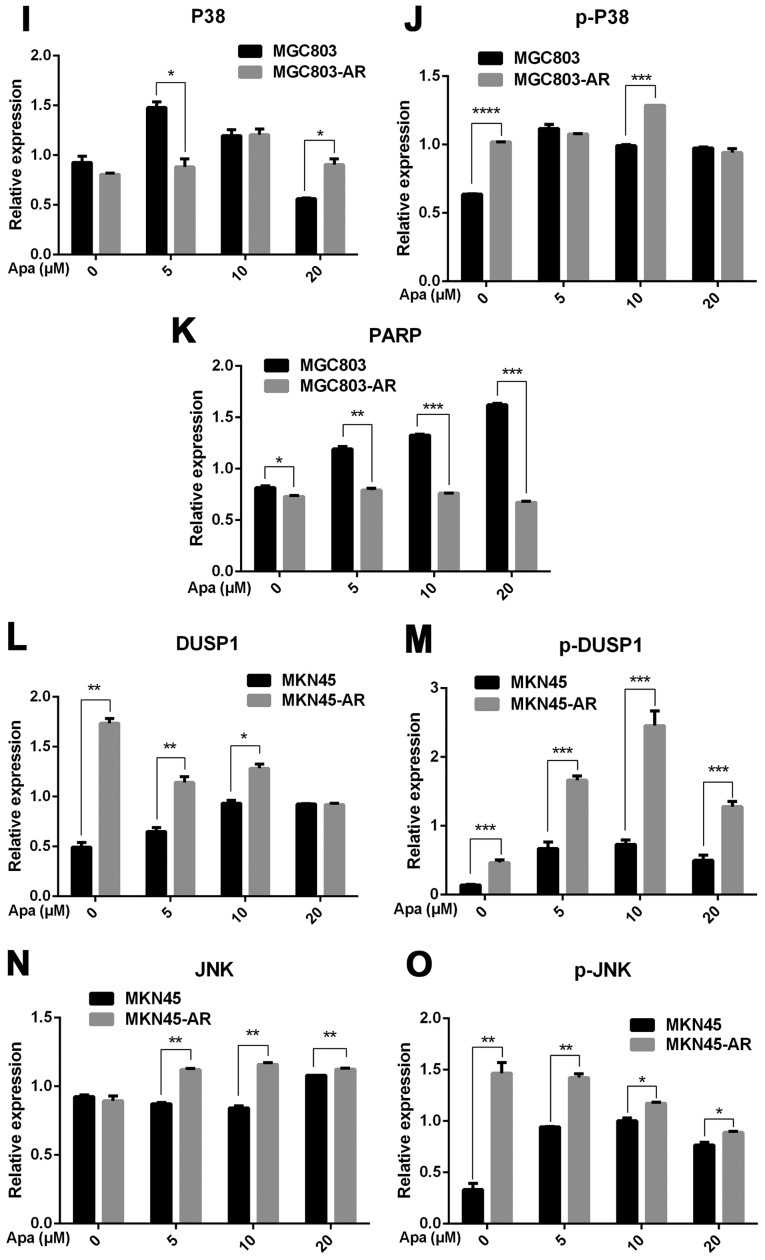
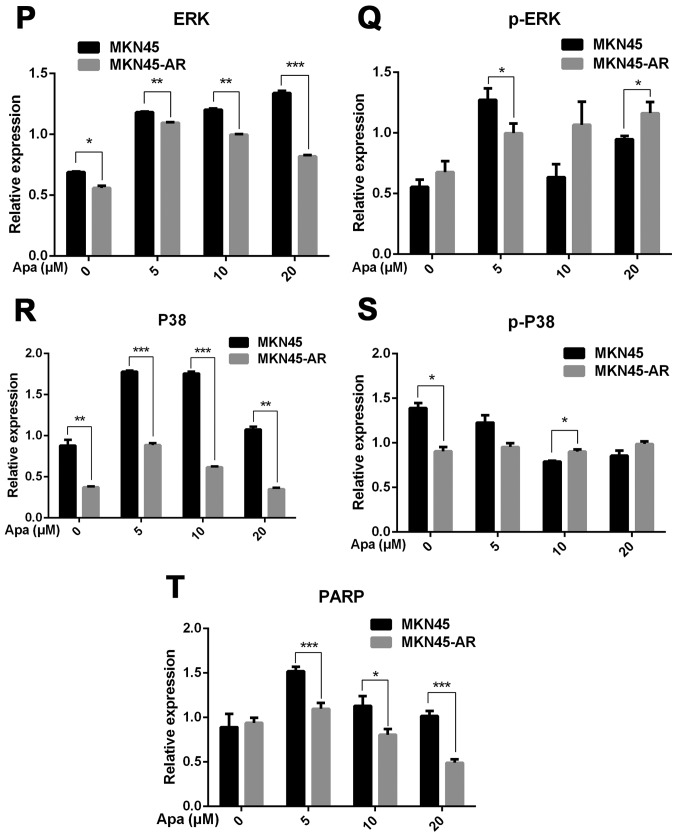
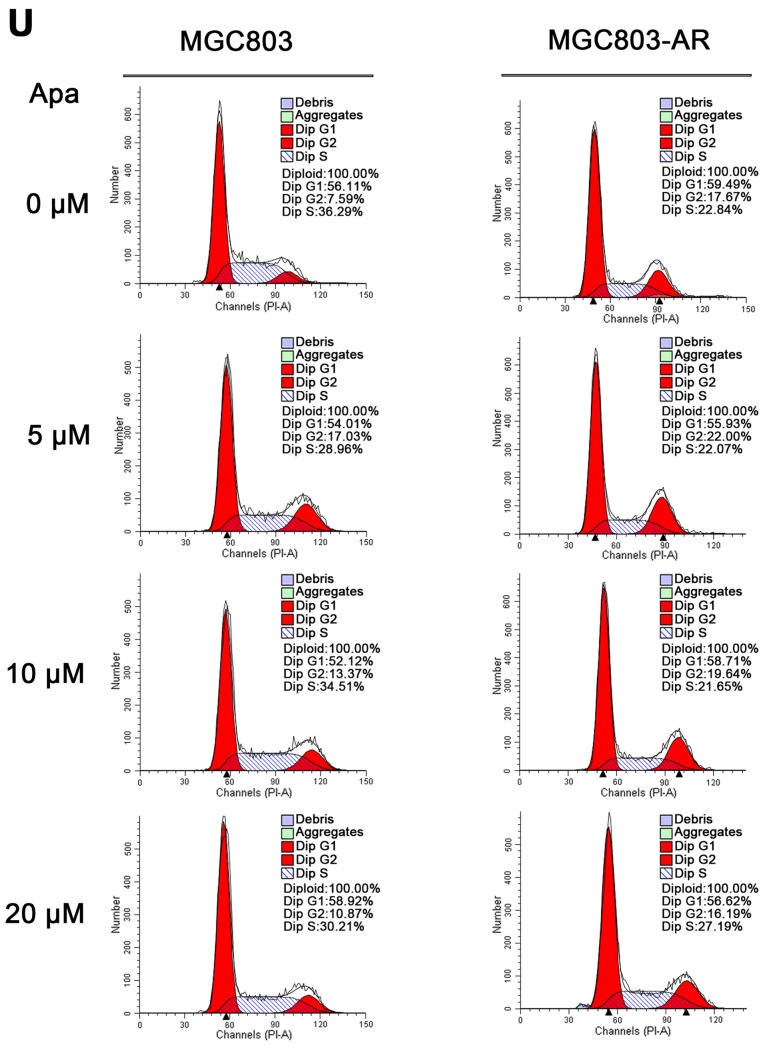
Apa resistance in gastric cancer cells affect cell cycle, apoptosis and MAPK signaling pathways. (A) MGC803, MGC803-AR, (B) MKN45 and MKN45-AR cells were treated for 24 h with Apa at the indicated concentrations. Total cell lysates were prepared and analyzed by western blot analysis using antibodies directed against MAPK signaling molecules (C) DUSP, (D) p-DUSP, (E) JNK, (F) p-JNK, (G) ERK, (H) p-ERK.. (I) P38, (J) p-P38, and (K) PARP in MGC803, MGC803-AR cells, and (L) DUSP, (M) p-DUSP (N) JNK, (O) p-JNK. (P) ERK, (Q) p-ERK, (R) P38, (S) p-P38, and (T) PARP in MKN45 and MKN45-AR cells. β-actin served as a loading control. Histograms representing the relative quantitative comparison of proteins between parental cells and resistant cells. (U) MGC803 and MGC803-AR cells were treated with Apa for 24 h at indicated concentrations, and cell cycle distribution was analyzed by flow cytometry. Histograms representing the relative cell cycle distribution between sensitive cells and resistant cells at (V) 0, (W) 5, (X) 10 and (Y) 20 µM Apa. Data are presented as the mean ± standard deviation (n=3; Student's t-test; *P<0.05, **P<0.01, ***P<0.001, ****P<0.0001). Apa, apatinib; AR, Apa-resistant; MAPK, mitogen-activated protein kinase; DUSP, dual-specificity phosphatase-1; JNK, c-Jun N-terminal kinase; ERK, extracellular signal-regulated kinase; p-, phosphorylated; PARP, poly(ADP-ribose) polymerase.

