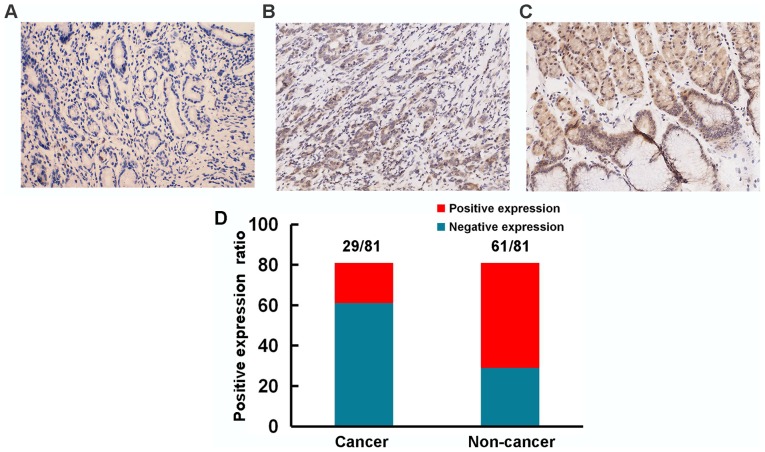
Figure 2.
Representative immunohistochemical images showing the expression of homeobox A5 (HOXA5) in paraffin-embedded sections (magnification, ×200). (A) A gastric cancer sample without HOXA5 expression. (B) A gastric cancer sample with a high expression level of HOXA5. (C) A non-cancer sample with a high expression level of HOXA5. (D) The positive HOXA5 staining ratio in GC samples and adjacent non-cancer samples.

