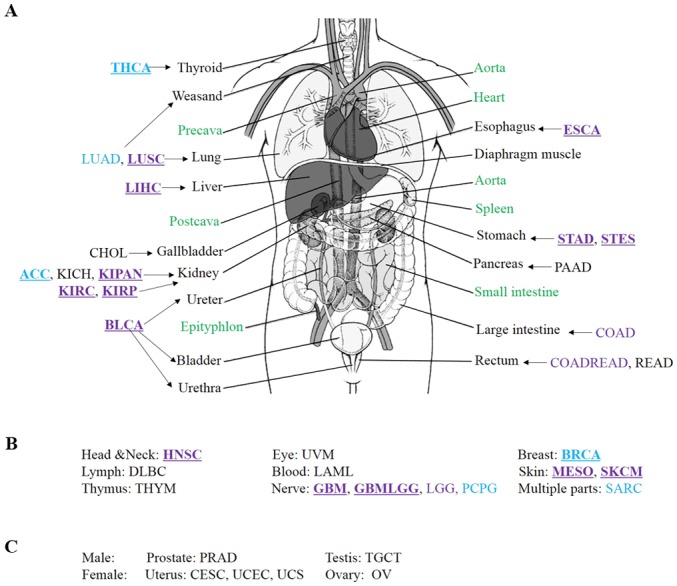
Figure 2.

Sex differences in the distribution of human cancer. (A) Distribution of cancers in internal organs. (B) Distribution of cancers which do not occur in internal organs. (C) Male- and female-specific cancers. Purple and blue represent male and female, respectively. Underlining indicate a type of cancer with a significant sex disparity. Green indicates that no primary cancer data were available for these internal organs.
