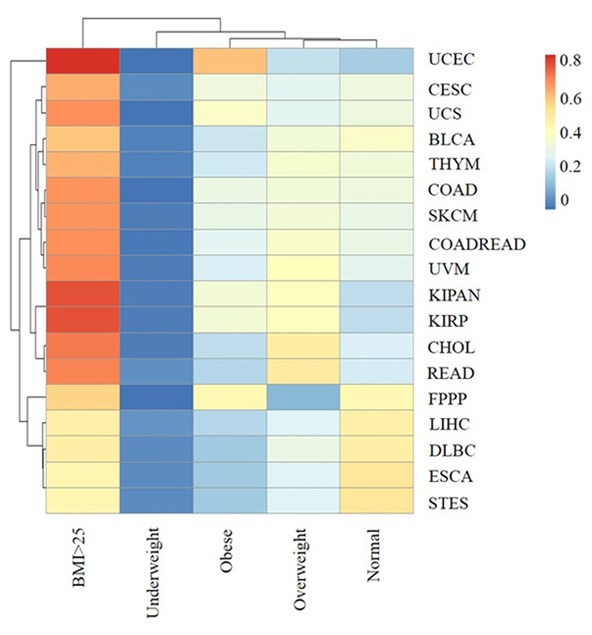
Figure 3.

The association of BMI range with each type of cancer. The rows and columns represent the types of cancer and the BMI ranges. The labels represent the distribution of BMI range for each type of cancer (0–0.8162). BMI: underweight (<18.5 kg/m2), normal (≥18.5 to <25.0 kg/m2) and high (≥25.0 kg/m2). The high group included two sub-groups: overweight (≥25 to <30 kg/m2) and obese (≥30 kg/m2).
