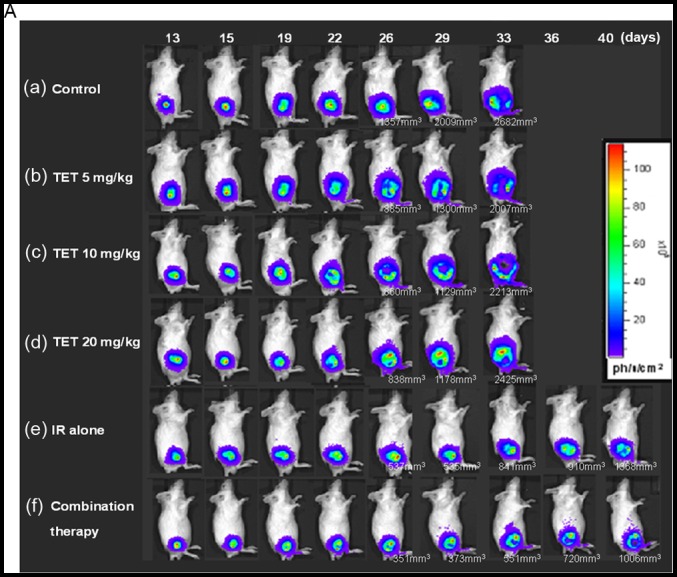
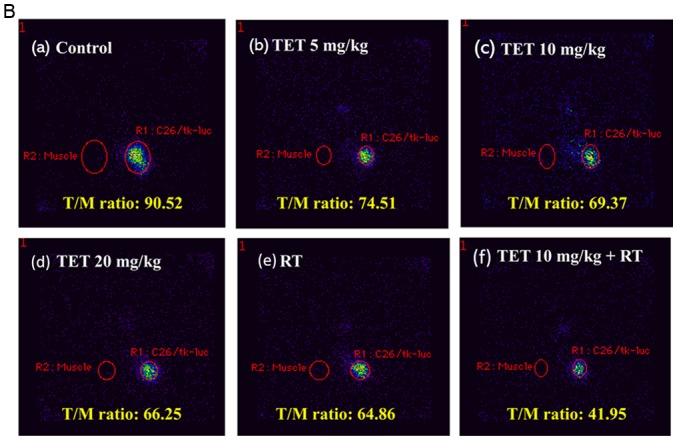
Figure 5.


Growth of CT26/tk-luc tumors in mice was monitored with bioluminescent imaging (BLI) and gamma scintigraphy. (A) The CT26/tk-luc tumor growth of a representative mouse in each group was assayed with BLI using the Xenogen IVIS50 system. (B) Gamma scintigraphy of CT26/tk-luc tumors in mice was performed at 24 h following 100 µCi/100 ml 131I-FIAU intravenous administration via the tail vein. The regions-of-interest (ROIs) of the tumors exhibited higher radioactivity compared with their normal counterparts, as illustrated by the tumor/muscle (T/M) ratios, which were the lowest in the combination group. a, control; b, TET 5 mg/kg × 12; c, TET 10 mg/kg × 6; d, TET 20 mg/kg × 3; e, IR (RT 3Gy ×6); f, TET 10 mg/kg × 6 + RT 3Gy × 6.
