 Simultaneous bioimaging of piR-36026 and piR-36743 using molecular beacons successfully visualized 4 different subtypes of breast cancer.
Abstract
Simultaneous bioimaging of piR-36026 and piR-36743 using molecular beacons successfully visualized 4 different subtypes of breast cancer.
A molecular beacon (MB) is a synthetic structured DNA oligonucleotide composed of a binding site targeting the sequence of interest and a reporter fluorescence molecule inactivated by a quencher absorbing fluorescence energy.1 When a MB binds with the target sequence, the quencher molecule is separated and the fluorescence is recovered. Simultaneously, the MB can inactivate the function of the target sequence. Therefore, MB-based bioimaging systems can allow not only non-invasive, real-time and quantitative imaging assays but also in situ functional assays at the molecular level in living organisms. Bioimaging studies using MBs for microRNAs (miRNAs), non-coding small RNAs (nsRNAs), have successfully sensed miRNA biogenesis in vitro and in vivo during neurogenesis, myogenesis and carcinogenesis.2
PIWI-interacting RNA (piRNA) is another class of nsRNA which is associated with PIWI proteins in the male germline.3 Originally, piRNAs have been known to play critical roles in germline development by regulating transposons and other targets to maintain genome integrity.4 Recently, they have also been found in various adult cell types, such as hippocampal neurons, germline stem cells, and cancer cells, and are involved in maintaining genome stability and epigenetic control of gene expression, although their functions are not yet fully understood.5 In cancer development, piRNAs play a driver role through degradation or inhibition of tumor suppressor genes and oncogenes, epigenetic modifications, such as DNA hypo/hypermethylation and histone modifications, and cell cycle regulation. Until now, next genome sequencing (NGS) and quantitative real-time polymerase chain reaction (qRT-PCR) have been widely used to detect endogenous piRNA expression.5 These approaches are laborious, time-consuming and non-reproducible. Additionally, many cancer molecular imaging studies have used single cancer biomarkers,6 which cannot represent various mechanisms and various subtypes of cancers. Similarly, our previous report demonstrated that the imaging of piR-36026 using piR-36026 MB rarely detected various subtypes of breast cancer.6b
In this study, we selected piR-36026 and piR-36743, which are specifically up-regulated in breast cancer tissue,5a to conduct molecular imaging of multiple piRNAs in a single breast cancer cell using 2 different MBs.
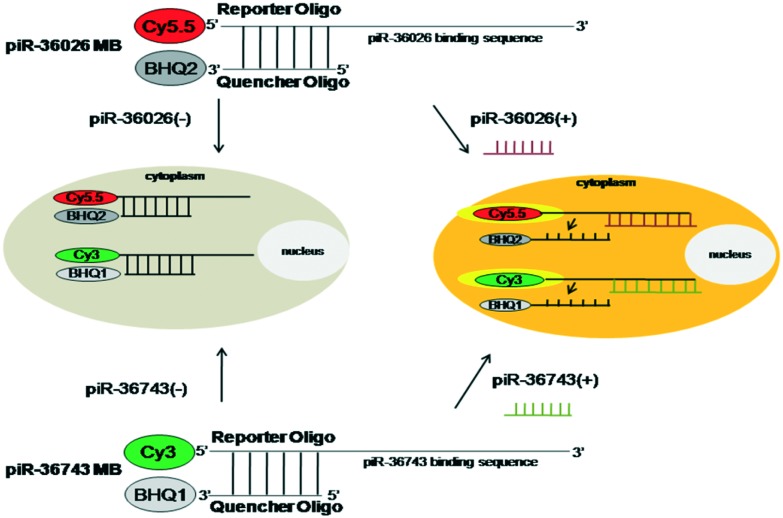
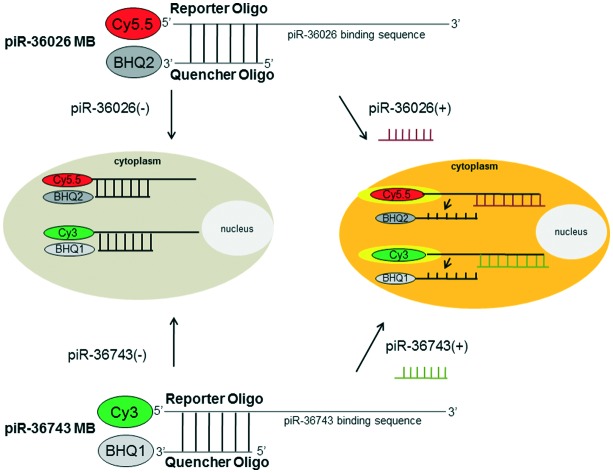
To simultaneously visualize the expression of piR-36743 and piR-36026 in a single cell, piR-36743 MB or piR-36026 MB was designed to be synthesized as a form of a partially double-stranded DNA oligonucleotide with Cy3 fluorescent dye (excitation/emission wavelength: 550/570 nm, reporter oligo) and black hole quencher 1 (BHQ1, quencher oligo) or Cy5.5 fluorescent dye (excitation/emission wavelength: 694/705 nm, reporter oligo) and BHQ2 (quencher oligo) (Fig. 1). The reporter oligo of piR-36743 MB or piR36026 MB has a complementary sequence to piR-36743 or piR-36026, which acts as its binding site and is labeled with Cy3 or Cy5.5 at the 5′ end, respectively. The quencher oligo of piR-36743 MB or piR36026 MB is designed to have sequences partially complementary to its corresponding reporter and to have BHQ1 or BHQ2 at the 3′ end. Both piRNA MBs were made as partially hybridized forms between each piRNA reporter oligo and each quencher oligo. The predicted functional mechanisms of both piRNA MBs as imaging probes of their target piRNA is described below. If there is no piR-36743 or piR-36026 in the cytoplasm of cells, the Cy3 activity of piR-36743 MB or the Cy5.5 activity of piR-36026 MB is quenched due to the absorption of the emitted fluorescence by BHQ1 or BHQ2 and results in no fluorescence signal. In contrast, when piR-36743 or piR-36026 is expressed in cells, the hybridization between piR-36743 and the piR-36743 reporter oligo or between piR-36743 and the piR-36743 reporter oligo results in the detachment of the quencher oligo from each MB and consequently a high fluorescence signal of Cy3 or Cy5.5 is generated in the cytoplasm of cells.
Fig. 1. Simplified drawing of piR-36026 MB and piR-36743 MB to simultaneously sense piR-36026 and piR-36743.
To determine the optimal ratio of the reporter oligo to the quencher oligo for generating piR-36743 MB or piR36026 MB, the quenching efficiency of the reporter oligo of piR-36743 or piR36026 (30 pmol) was measured by incubating the reporter oligo with different concentrations of its corresponding quencher oligo on a black plate for 1 hour at room temperature. Both reporter oligos were gradually quenched and showed maximal quenching efficiency at 60 pmol for each quencher oligo (Fig. S1a†). A 1 : 2 molar ratio of reporter oligo to quencher oligo was determined to form piR-36743 MB and piR-36026 MB. Quantitative fluorescence analysis using a spectrometer demonstrated that piR-36743 MB and piR36026 MB revealed a dose-dependent and gradual increase in fluorescence intensity in the presence of exogenous piR-36743 or piR36026, respectively (Fig. S1b†). Meanwhile, both piRNA MBs remained in a quenched state with the treatment with exogenous piR-126541, which was used as the negative control and is only expressed in mouse testes.7 The chemical and functional stabilities of piR-36743 MB and piR-36026 MB were verified after incubation in PBS buffer and cell medium in a tube for two days. The quenched state of both piRNA MBs was stable for 2 days and the fluorescence was activated only upon the addition (200 pmol) of its target piRNA (Fig. S2†). These results demonstrated the great specificity of piR-36743 MB and piR-36026 MB to detect piR-36743 and piR36026.
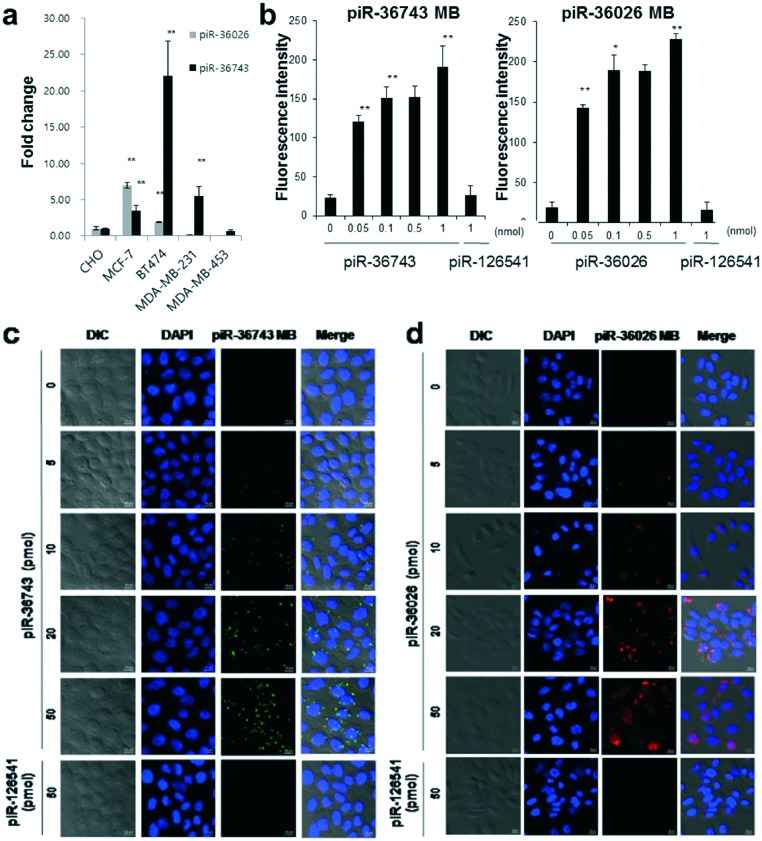
To simultaneously visualize the expression of multiple piRNAs in a single breast cancer cell using piR-36743 MB and piR36026 MB, we first examined the endogenous expression of piR-36743 and piR-36026 in four different human breast cancer cell lines including MCF-7 (luminal A), BT474 (luminal B), MDA-MB-453 (HER-2 over-expressing) and MDA-MB-231 (triple negative) and a normal cell line (CHO cells, Chinese hamster ovary cells) by qRT-PCR. Interestingly, the four breast cancer cell lines showed distinct expression patterns of piR-36743 and piR-36026 (Fig. 2a). Both piRNAs were expressed at a relatively high level in MCF-7 and BT-474 cells compared with CHO cells. The expression level of piR-36743 in MCF-7 cells was lower than that of piR-36026.
Fig. 2. Specificity of piR-36743 MB and piR-36026 MB to detect piR-36743 and piR-36026 expression, respectively. (a) Distinct expression patterns of piR-36743 and piR-36026 in different breast cancer cell lines (*p < 0.05, **p < 0.005). (b) Fluorescence intensities of piR-36743 MB and piR-36026 MB in CHO cells (*p < 0.05, **p < 0.01). Confocal microscope imaging analysis of (c) piR-36743 MB and (d) piR-36026 MB in CHO cells. The Cy3 fluorescence images (green color) of piR-36743 MB to detect piR-36743 and the Cy5.5 fluorescence images (red color) of piR-36026 MB to detect piR-36026 were obtained. All images were merged with the 4′,6-diamidino-2-phenylindole (DAPI) (nucleus staining) and cellular morphology images.
However, an opposite expression pattern was observed in BT-474 cells: the expression level of piR-36743 was higher than that of piR-36026. MDA-MB-231 cells showed a high expression of piR-36743 but no expression of piR-36026. In the MDA-MB-453 cell line, there was no significant expression of both piRNAs. We transfected 50 pmol of piR-36743 MB or piR36026 MB into CHO cells, which rarely express both piR-36743 and piR-36026 (Fig. 2a). Quantitative fluorescence analysis confirmed that both piRNA MBs in CHO cells stayed in a quenched state in the absence of exogenous piR-36743 or piR-36026 and in the presence of piR-126541 (Fig. 2b). In contrast, as the concentration of exogenous piR-36743 or piR-36026 increased up to 1 nmol, the total fluorescence of piR-36743 MB or piR-36026 MB in CHO cells significantly and sequentially intensified due to the gradual detachment of the quencher oligo from each piRNA MB by the hybridization of each piRNA with its counterpart piRNA MB. Similarly, confocal microscopy images of both piRNA MBs in CHO cells demonstrated that the fluorescence brightness increased in a concentration-dependent manner of exogenous piR-36743 or piR-36026 in the cytoplasm, whereas the fluorescence of both piRNA MBs remained quiescent in the presence of piR-126541 (Fig. 2c and d).
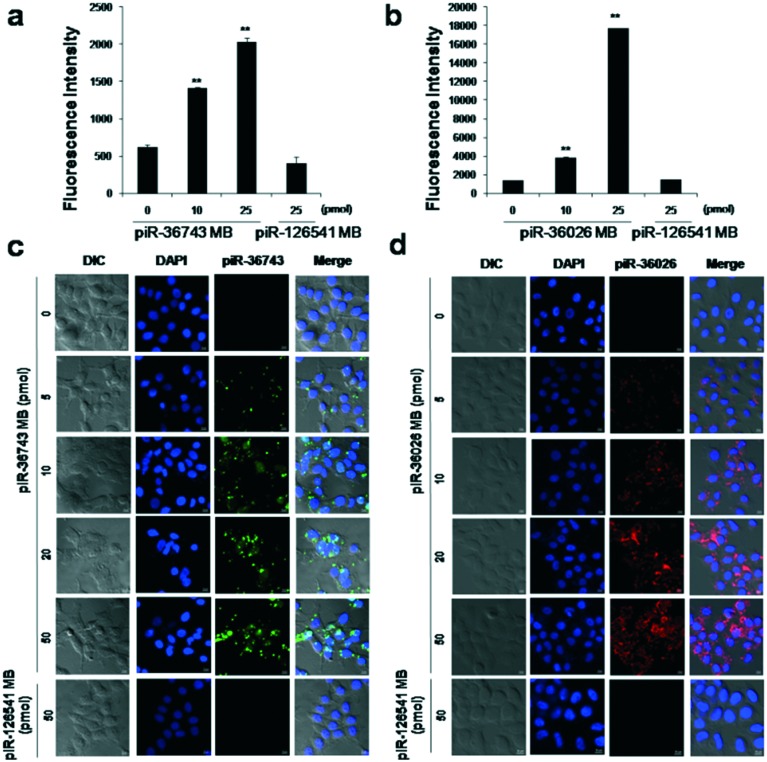
To evaluate the feasibility of piRNA MBs for monitoring endogenous piRNA expression in breast cancer, various concentrations of both piRNA MBs were transfected into MCF-7 cells separately. A piR-126541 MB with a similar structure to that of piR-36743 MB was used as the negative control and showed a great specificity to detect piR-126541 (Fig. S3†). Quantitative fluorescence analysis demonstrated that the relatively high expression of both piR-36743 and piR-36026 in MCF-7 cells resulted in a gradual increase in the fluorescence intensity of Cy3 or Cy5.5 in response to the concentration of piR-36743 MB or piR-36026 MB due to a dose-dependent detachment of each quencher oligo from the MB backbone (Fig. 3a and b).
Fig. 3. Detection of endogenous piR-36743 and piR-36026 in MCF-7 cells. Quantitative fluorescence activities of (a) piR-36743 MB to detect endogenous piR-36743 and (b) piR-36026 MB to detect endogenous piR-36026 in MCF-7 cells (**p < 0.005). Confocal microscopy analysis of (c) piR-36743 MB and (d) piR-36026 MB in MCF-7 cells. All images were merged with the DAPI and cellular morphology images.
However, piR-126541 MB showed no significant fluorescence recovery because of the lack of endogenous expression of piR-126541 in MCF-7 cells. Similarly, confocal microscopy images of both piRNA MBs demonstrated that the high expression of both piR-36743 and piR-36026 in MCF-7 cells resulted in a dose-dependent increase in fluorescence brightness of Cy3 or Cy5.5 in the cytoplasm, while no fluorescence signal was observed in the presence of piR-126541 MB (Fig. 3c and d).
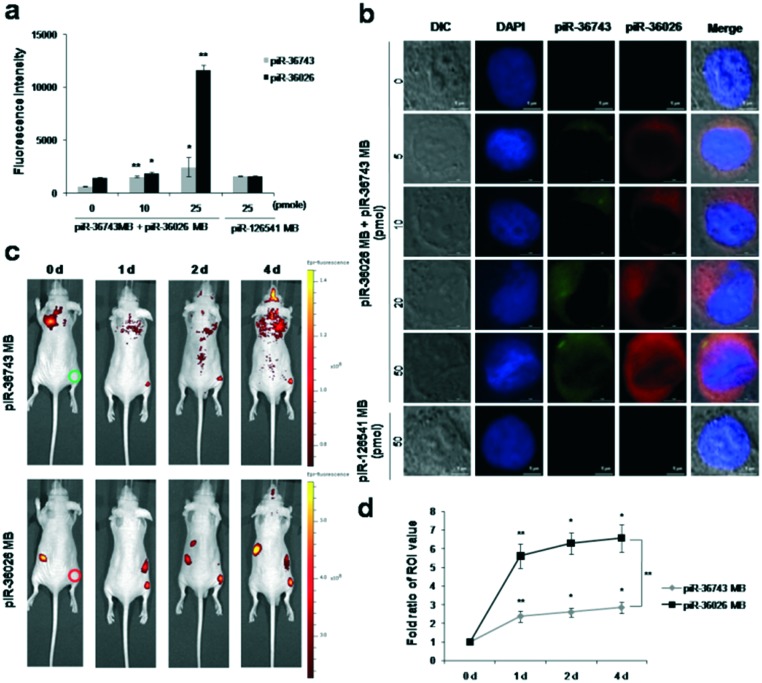
To simultaneously visualize the expression of endogenous piR-36743 and piR-36026 in a single breast cancer cell, piR-36743 MB was co-transfected with piR-36026 MB into 4 different subtypes of breast cancer cells. In MCF-7 cells simultaneously transfected by both piRNA MBs, the fluorescence intensities of Cy3 from piR-36743 MB and Cy5.5 from piR-36026 MB gradually increased (Fig. 4a). It was noted that the fluorescence signals of piR-36026 MB in MCF-7 cells were significantly higher than that of piR-36743 MB due to a relatively higher expression of piR-36026 than piR-36743 (Fig. 2a). Similarly, dual transfection of both piRNA MBs revealed unique expression patterns of endogenous piR-36743 and piR-36026 with a high intensity of Cy3 and a low intensity of Cy5.5 in BT-474 cells, high signals of Cy3 and rare signals of Cy5.5 in MDA-MB-231 cells, and no activity of both Cy3 and Cy5.5 in MDA-MB-453 cells (Fig. S4†). The confocal microscopy images demonstrated that a single cell from 4 different subtypes of breast cancer transfected with both piRNA MBs was visualized by each unique expression pattern of piR-36743- and piR-36026-dependent color change. In MCF-7 cells that showed a high expression of both piRNAs and a relatively higher expression from piR-36026 than piR-36743, the cytoplasmic fluorescence brightness of Cy5.5 from piR-36026 MB visualized by red fluorescence was greater than that of Cy3 from piR-36743 MB visualized by green fluorescence (Fig. 4b). A single MCF-7 cell was visualized as yellowish red at 50 pmol of dual transfection with both piRNA MBs by the merging of green and red fluorescence. In contrast, in a single BT-474 cell that had opposite expression patterns of piR-36026 and piR-36743 as compared to MCF-7 cells, the green fluorescence intensity of Cy3 was much stronger than the red fluorescence intensity of Cy5.5 and consequently, a yellowish green fluorescence was obtained from a single BT-474 cell at 50 pmol of transfection with both piRNA MBs by the merging of green from piR-36743 MB and red from piR-36026 MB (Fig. S5a†). A single MDA-MB-453 cell transfected with 50 pmol of both piRNA MBs was displayed as dark green due to the rare expression of piR-36026 which resulted in no red fluorescence signal of Cy5.5 (Fig. S5b†). Meanwhile, a single MDA-MB-453 cell showed no red and green fluorescence from piR-36743 MB and piR-36026 MB due to no significant endogenous expression of piR-36743 and piR-36026 (Fig. S5c†).
Fig. 4. Simultaneous imaging of piR-36743 and piR-36026 in breast cancer cells. (a) Dual quantitative fluorescence activities of piR-36743 MB and piR-36026 MB in MCF-7 cells. MCF-7 cells were simultaneously transfected by both piRNA MBs. (b) Confocal microscopy images of a single MCF-7 cell simultaneously transfected by piR-36026 MB and piR 36743 MB. The fifth column shows the merged images and cellular morphology. Scale bars, 10 μm. (c) In vivo dual imaging of piR-36743 and piR-36026 in MCF-7 cells. MCF-7 cells transfected with piR-36743 MB (right thigh, red circle, top) and piR 36026 MB (right thigh, red circle, bottom) or without (left thigh, used as the control) both piRNA MBs. (d) ROI analysis of the in vivo dual imaging of piR-36743 and piR-36026. The fold ratio of each right thigh signal was compared with the fold ratio of each corresponding left thigh signal. Data are presented as means ± standard deviations of triplicate samples (*p < 0.05, **p < 0.01).
To simultaneously visualize the endogenous expression of multiple piRNAs using piRNA MBs in breast cancer in vivo, MCF-7 cells (1 × 10⁷) transfected without and with piR-36743 MB and piR-36026 MB were subcutaneously implanted into the left thigh and right thigh of nude mice (n = 3), respectively. A gradual and strong fluorescence signal of Cy3 from piR-36743 MB and Cy5.5 from piR-36026 MB was observed from the right thigh of the nude mice for 4 days, while the left thigh implanted with MCF-7 cells without the transfection of both piRNA MBs showed no fluorescence activity (Fig. 4c). Interestingly, quantitative measurement of in vivo fluorescence signals of piR-36743 MB and piR-36026 MB from the right thigh of the nude mice, as determined by the region of interest (ROI), revealed that the increase in Cy5.5 intensity signaling the expression of endogenous piR-36026 was relatively higher than the increase in Cy3 intensity showing the expression of endogenous piR-36743 (Fig. 4d). The ROI demonstrated relatively higher expression of piR-36026 than piR-36743 in MCF-7 cells.
Among several types of nsRNAs, piRNA can be a good biomarker for the diagnosis of cancers because it is involved in cancer development in various ways and shows aberrant expression patterns by cancer type. For example, in breast cancer, 12 piRNAs (piR-4987, piR-20365, piR-20485, piR-20582, piR-34736, piR-36249, piR-35407, piR-36318, piR-34377, piR-36743, piR-36026, and piR-31106) were reported to be significantly differently expressed between tumors and matched non-malignant mammary epithelial cells.8 Non-invasive molecular imaging of specific piRNAs needs to be developed to provide great knowledge about cellular and disease processes.
In this study, we synthesized piR-36026 MB containing Cy5.5 (at an absorbance/emission of 694/705 nm) and BHQ2 and piR-36743 MB containing Cy3 (at an absorbance/emission of 550/570 nm) and BHQ1 to simultaneously visualize the expression of piR-36026 and piR-36743. Four different subtypes of breast cancer had distinct expression patterns for piR-36026 and piR-36743. The in vitro imaging analysis of a single breast cancer cell using both piR-36026 MB and piR-36743 MB showed a great fluorescence sensitivity in detecting high levels of piR-36026 and low levels of piR-36743 in MCF-7 cells, low levels of piR-36026 and high levels of piR-36743 in BT-474 cells, no expression of piR-36026 and high levels of piR-36743 in MDA-MB-231 cells, and no expression of both piRNAs in MDA-MB-453 cells. In addition, in vivo imaging of MCF-7 cells transfected with both piR-36026 MB and piR-36743 MB successfully visualized the unique expression patterns of piR-36026 and piR-36743. These findings demonstrate that dual transfection of both piRNA MBs to simultaneously detect piR-36026 and piR-36743 can be used to diagnose a variety of breast cancers. Since piRNA MBs are low cost, easy to design, synthesize, and handle, and can undergo straightforward analysis, they have great potential as tools to study the expression and functions of many different piRNAs and diagnose various piRNA-regulating cellular developments and diseases in vitro and in vivo.
This work was supported by the Basic Science Research Program through the National Research Foundation of Korea (NRF) grant funded by the Korean government (MSIP; Ministry of Science, ICT & Future Planning (No. 2017R1A2B2002042 and No. 2017R1C1B1008436) and the Ministry of Education (No. 2016R1D1A1B03936192 and 2017R1D1A3B03036431).
Conflicts of interest
The authors declare no competing interests.
Supplementary Material
Footnotes
†Electronic supplementary information (ESI) available. See DOI: 10.1039/c7md00515f
References
- (a) Tyagi S., Kramer F. R. Nat. Biotechnol. 1996;14:303–308. doi: 10.1038/nbt0396-303. [DOI] [PubMed] [Google Scholar]; (b) Hwang D. W., Song I. C., Lee D. S., Kim S. Small. 2010;6:81–88. doi: 10.1002/smll.200901262. [DOI] [PubMed] [Google Scholar]
- (a) Kang W. J., Cho Y. L., Chae J. R., Lee J. D., Ali B. A., Al-Khedhairy A. A., Lee C. H., Kim S. Biomaterials. 2012;33:6430–6437. doi: 10.1016/j.biomaterials.2012.05.056. [DOI] [PubMed] [Google Scholar]; (b) Kang W. J., Cho Y. L., Chae J. R., Lee J. D., Choi K. J., Kim S. Biomaterials. 2011;32:1915–1922. doi: 10.1016/j.biomaterials.2010.11.007. [DOI] [PubMed] [Google Scholar]; (c) Kim J. K., Choi K. J., Lee M., Jo M. H., Kim S. Biomaterials. 2012;33:207–217. doi: 10.1016/j.biomaterials.2011.09.023. [DOI] [PubMed] [Google Scholar]; (d) Ko H. Y., Lee J., Joo J. Y., Lee Y. S., Heo H., Ko J. J., Kim S. Sci. Rep. 2014;4:4626. doi: 10.1038/srep04626. [DOI] [PMC free article] [PubMed] [Google Scholar]; (e) Noh E.-H., Ko H. Y., Lee C. H., Jeong M.-S., Chang Y. W., Kim S. J. Mater. Chem. B. 2013;1:4438–4445. doi: 10.1039/c3tb20710b. [DOI] [PubMed] [Google Scholar]
- Gunawardane L. S., Saito K., Nishida K. M., Miyoshi K., Kawamura Y., Nagami T., Siomi H., Siomi M. C. Science. 2007;315:1587–1590. doi: 10.1126/science.1140494. [DOI] [PubMed] [Google Scholar]
- Luteijn M. J., Ketting R. F. Nat. Rev. Genet. 2013;14:523–534. doi: 10.1038/nrg3495. [DOI] [PubMed] [Google Scholar]
- (a) Hashim A., Rizzo F., Marchese G., Ravo M., Tarallo R., Nassa G., Giurato G., Santamaria G., Cordella A., Cantarella C., Weisz A. Oncotarget. 2014;5:9901–9910. doi: 10.18632/oncotarget.2476. [DOI] [PMC free article] [PubMed] [Google Scholar]; (b) Lee E. J., Banerjee S., Zhou H., Jammalamadaka A., Arcila M., Manjunath B. S., Kosik K. S. RNA. 2011;17:1090–1099. doi: 10.1261/rna.2565011. [DOI] [PMC free article] [PubMed] [Google Scholar]; (c) Suzuki R., Honda S., Kirino Y. Front. Genet. 2012;3:204. doi: 10.3389/fgene.2012.00204. [DOI] [PMC free article] [PubMed] [Google Scholar]
- (a) Jiang Y. L., McGoldrick C. A., Yin D., Zhao J., Patel V., Brannon M. F., Lightner J. W., Krishnan K., Stone W. L. Bioorg. Med. Chem. Lett. 2012;22:3632–3638. doi: 10.1016/j.bmcl.2012.04.055. [DOI] [PubMed] [Google Scholar]; (b) Lee Y. J., Moon S. U., Park M. G., Jung W. Y., Park Y. K., Song S. K., Ryu J. G., Lee Y. S., Heo H. J., Gu H. N., Cho S. J., Ali B. A., Al-Khedhairy A. A., Lee I., Kim S. Biomaterials. 2016;101:143–155. doi: 10.1016/j.biomaterials.2016.05.052. [DOI] [PubMed] [Google Scholar]; (c) Peng X. H., Cao Z. H., Xia J. T., Carlson G. W., Lewis M. M., Wood W. C., Yang L. Cancer Res. 2005;65:1909–1917. doi: 10.1158/0008-5472.CAN-04-3196. [DOI] [PubMed] [Google Scholar]
- Ortogero N., Schuster A. S., Oliver D. K., Riordan C. R., Hong A. S., Hennig G. W., Luong D., Bao J., Bhetwal B. P., Ro S., McCarrey J. R., Yan W. J. Biol. Chem. 2014;289:32824–32834. doi: 10.1074/jbc.M114.613232. [DOI] [PMC free article] [PubMed] [Google Scholar]
- Ng K. W., Anderson C., Marshall E. A., Minatel B. C., Enfield K. S. S., Saprunoff H. L., Lam W. L., Martinez V. D. Mol. Cancer. 2016;15:5. doi: 10.1186/s12943-016-0491-9. [DOI] [PMC free article] [PubMed] [Google Scholar]
Associated Data
This section collects any data citations, data availability statements, or supplementary materials included in this article.


